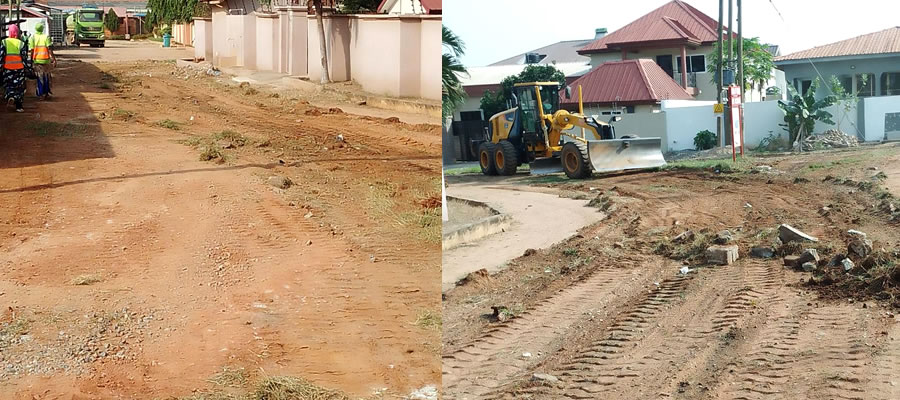

Potable water supply in the urban/peri-urban areas of the municipality has been a major challenge to the Assembly, especially when the Assembly has no direct control over urban water supply. Areas like Dome, Taifa, Agbogba and Ashongman Musuko have limited or no access to pipe-borne water. Others depend on tanker services and a few hand dug wells.
In general therefore, the price of water is fairly high in these urban communities. The situation is further worsened by the steadily increasing population through the influx of skilled and unskilled labour from the rural areas. To improve this situation the municipal Assembly will support and facilitate government strategies to accelerate the provision of safe water in the urban areas, especially the inclusion of rain water facilities when building.
In the peri-urban areas and small towns however, the Municipal Assembly is responsible for water supply. The Assembly is currently managing two small towns’ piped schemes through Water and Sanitation Development Boards (WSDD). These are Abokobi-Oyarifa-Teiman Area scheme, and Pantang Area Water scheme. The two schemes cover fifteen communities. This places an obligation on the Assembly to ensure that the facilities are managed in a sustainable manner. The water and sanitation coverage in the municipality is given below:
• % of household with private toilet :32%
• % of population using public toilet :37%
• % of population with access to potable water : 42%
Some of the problems that need to be solved to ensure achievement of target include:
• Low participation of women in the water management in the management of piped schemes
• Inability to meet demand due to rapidly increasing population
• Problem in acquisition of lands on which the facilities are located
• Bye laws not gazette to facilitate prosecution
• Poor sanitation in public schools and communities
Waste Management
The rate of waste generation and management in the municipality is a matter of concern to the Assembly. With the increasing influx of people and the rapid urbanization, huge amounts of human and industrial waste are generated at an alarming rate. It is estimated that about 385 tonnes of solid waste is generated monthly out of which 261 tonnes are collected which represents 67%. This leaves a substantial amount of backlog that creates various kinds of inconveniences including health hazard to people in the municipality. Out of the 261 tonnes collected the private sector collects about 81% through door-to-door collection.
Apart from the door-to-door collection, wastes are collected in containers placed at vantage points by the Assembly. The absence of proper engineered final disposal site is a major constraint. Some of the problems that need to be solved to ensure achievement of target include:
• Lack of engineered final disposal site
• Inadequate machinery and equipment
• Poor public attitude towards waste management
• Poor treatment of sewage and liquid waste
• Inadequate number of refuse containers for communal center
• Irregular and untimely waste collection both at the communal dump site and residential areas
Method of Waste Disposal
Solid waste Disposal
The figure 1.13 depicts that the collection method (50.9%) is the most common method used in solid waste disposal by households, while about a quarter (25.7%) of household’s burn their waste and 10.8 percent use the public dump (container) method. In addition, 1.7 percent of households use the public dump (open space) for disposal of waste while nearly 3.0 percent of households dump their waste indiscriminately. 0.9 percent have different ways of dumping their waste. Furthermore, 52 percent of urban households use the collection method to dispose of solid waste as compared to 35.3 percent of rural household. On other hand, more rural households (35.7%) than urban (24.6%) households burn their solid waste.
Liquid Waste Disposal
It depicted figure 1.14 that a third (33.5%) of households throw their waste onto the compound. Almost equal proportions of households ranging dispose of their liquid waste into pits (soak way), onto the street/outside and into the gutter. Significant proportions of households also throw their waste into the sewerage system (12.5%) and through drainage system into a gutter (9.7%). The pattern of liquid waste disposal in the localities is not too different from what pertains in the Municipality but the few differences are that, a higher proportion of urban households (15.7%) dispose of their liquid waste into the gutter as compared to 7.7 percent of their rural counterparts who do same. Again, 17 percent of rural households dispose of their liquid waste through the sewerage system as compared to 12 percent in urban areas.
Date Created : 11/17/2017 9:40:45 AM


 facebook
 X
X
 Youtube
 instagram
 +233 593 831 280
 0800 430 430
 GPS: GE-231-4383
 info@ghanadistricts.com
 Box GP1044, Accra, Ghana