- Item

POPULATION SIZE AND DISTRIBUTION
The 2021 PHC puts the total population of the district at 66,181 comprising 32,931males (49.76 %) and 33,250 females (50.24 %). In terms of rural urban distribution, the district has 99.9 percent of its in-habitants living in rural localities. This implies that the district is to a large extent a rural one. Fig 1.6 depicts projected population for 2021 to 2025. The district population growth rate which is about (2.5 %) is slightly higher than the regional growth rate of about (2.3 %).
SPATIAL ANALYSIS OF SETTLEMENTS
The settlement pattern in the district is generally dispersed but with a few nucleated and linear patterns in the relatively bigger towns. Housing in the district is largely traditional huts built in the form of compound houses with a good number roofed with thatch and roofing sheets. The district capital and other few communities have buildings built with cement and roofed with aluminum sheets. The functional hierarchy of settlements in the district positions Yagaba, the district capital as the potential highest ranked settlements among the 48 communities in the district. This is in terms of functional complexity and linkages relating to distribution of services and infrastructure.
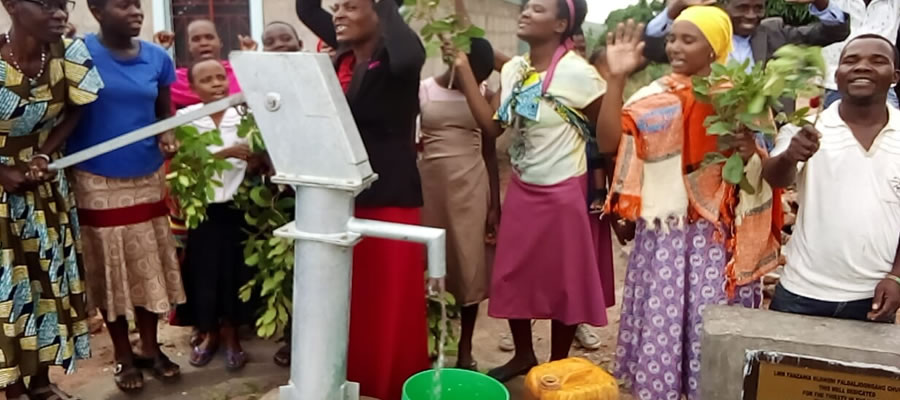
This is on account of the selection of Yagaba as the district capital, attracting facilities and economic infrastructure more than any other community in the district. As a result of this, Yagaba is gradually becoming the hub of commercial and industrial activities attracting a huge number of migrants and investors in search of existing opportunities. The district being about 100 percent rural, it is important to mention that there is no much disparity in terms of infrastructure among the communities in the district. The common feature that runs through the various communities is the woeful inadequate socio-economic infrastructure including roads, health facilities, educational infrastructure, water facilities, electricity, banks, police stations, post offices, telephones, tribunals, toilet facilities and the like. Table 1.4 and figures 1.3-1.5 depicts the spatial distribution of basic infrastructure, facilities and services in the district.


SEX RATIO
The sex ratio is the ratio of males per 100 females. For all ages, the sex ratio of the district stands at 99.9 percent. This means that there are more females than males in the district. This follows the national and the regional patterns where the sex ratio for all ages stands at 95.2 and 98.4 respectively.
DEPENDENCY RATIO
This is the ratio of persons in the “dependent” ages (population under 15 years and 65 years and older) to those in the “economically productive” ages of 15-64 years. The dependency ratio for the district is 101.4. This ratio reveals that there are about 101 persons in the dependent ages for every 100 persons in the working age. The dependency ratio for the district is higher than both the national and regional averages which stand at 75.6 and 96.8 percent respectively. These figures suggest a large proportion of children and the aged in the district. Dependency among the male population is relatively higher (109.7) than among the female population (93.6). This follows the national and the regional trends where dependency ratios for males are higher than those of females
MIGRATION, FERTILITY AND MORTALITY
Fertility, mortality and migration are principal determinants of population growth at a particular point in time. The composition of the population is important for development planning and policy formulation at all levels (national, regional, district and locality) of governance.
FERTILITY
The 2021 PHC put the Total Fertility Rate (TFR), General Fertility rate (GFR) and Crude Birth Rate (CBR) of the district at 3.4, 100.1, and 22.8 respectively. TFR is defined as the average number of children that would be born to a woman by the time she completes childbearing if she were to experience the prevailing age-specific fertility rate. GFR indicates births relative to the number of women in the reproductive age. The age structure of the district influences the GFR of the district. The CBR on the other hand is the simplest and most frequently used measure of fertility. It is crude and always expressed per 1000 population. It is crude because it includes all ages and both sexes in the estimation.
MORTALITY
The total household deaths in the district stand at 277 (2021 PHC). This provides 5.9 crude death rate in the district. Analysis of causes of deaths in the district indicates that accidents, violence, homicide or suicide accounts for 6.1 percent of total deaths in the district. Pregnancy accounts for 3.2 percent which is relatively higher than both the national (1.9%) and the regional (2.2%) percentages. This could be attributed to the inadequate health professionals and infrastructure in the district. Other causes of death in the district accounts for about 94 percent of total deaths in the district. Death among children under five is high. This could be attributed to inadequate health delivery especially postnatal services in the district. Death among male children under five in the district is higher than that of female children. For all ages, males die more than females.
HOUSEHOLD-HEADSHIP AND COMPOSITION
The district has a total household population of 45,160 with 5, 214 headships out of which 22 percent and 11 percent are headed by males and females respectively. This implies that male household headship is relatively higher than the female household headship in the district. This is similar to the national as well as the regional trends. The household headship in the district implies that males control more resources than females in the district.
Date Created : 2/5/2026 6:33:23 AM


Local Gov Ministry
Int of Local Gov Studies
Ministry of Information
Local Gov Service
Ghana MPs
Ghana Hospitals
NALAG
 facebook
 X
X
 Youtube
 instagram
 whatsapp
 +233 593 831 280
+233 20 230 9497
+233 593 831 280
+233 20 230 9497 0800 430 430
 GPS: GE-231-4383
 info@ghanadistricts.com
 Box GP1044, Accra, Ghana