
Introduction
Economic activity aims to provide a secure and regular income. Inactivity can result in social vices, especially among the youth. Many conflicts have been linked to the idleness of youth in communities where these conflicts have taken place. Depending on the resources and opportunities in a given area, people may be self-employed or engaged by others for a regular income or other forms of reward for the services they provide. This chapter analyses the economic activity status of the people in the district, as to how many are economically active (employed and unemployed) and economically not active.
Economic Activity Status
The 2010 population and housing census collected information on the status of economic activities of the population aged 15 years and older during the seven days preceding the census. These were classified as employed, unemployed or not economically active. Table 4.1 shows the status of economic activity of the population 15 years and older in the Lambussie-Karni District.
The economically active male population (9,503) is 72.3 percent of male population in the district who are 15 years and above. Of this 96.4 percent are employed and 3.6 percent unemployed. The female economically active population is 63.0 percent with 96.3 percent employed while 3.7 percent are unemployed.
Activity status by sex and age
Table 4.2 shows economic activity status of population 15 years and older by sex and age. From the table, about 53 percent of persons aged 15-19 years are economically not active, however, quite a number (45.0%) of them are employed. Similarly, 63.2 percent of persons aged 20-24 years are employed while 32.2 are economically not active.
From age 25 years, the proportion of persons employed within the age groups increase with increasing age till age 44 years and thereafter starts to decrease. Unemployed is generally low among the population, but it is high for the following age groups of 20-24 years (4.6%) and 25-29 years (3.8%).
Among the males population 15 years and older 69.7 percent are employed with 2.6 percent unemployed and the economically not active of 27.7 percent. The age cohort 40-44 has the highest proportion 88.9 percent being employed, 1.4 percent being unemployed and 16.8 percent are economically not active.
Occupation
This refers to the type of work the person was engaged in at the establishment where he/she worked. This question was asked to only persons five years and older who worked seven days preceding the Census Night, and those who did not work but had a job to return to as well as those unemployed who had worked before.
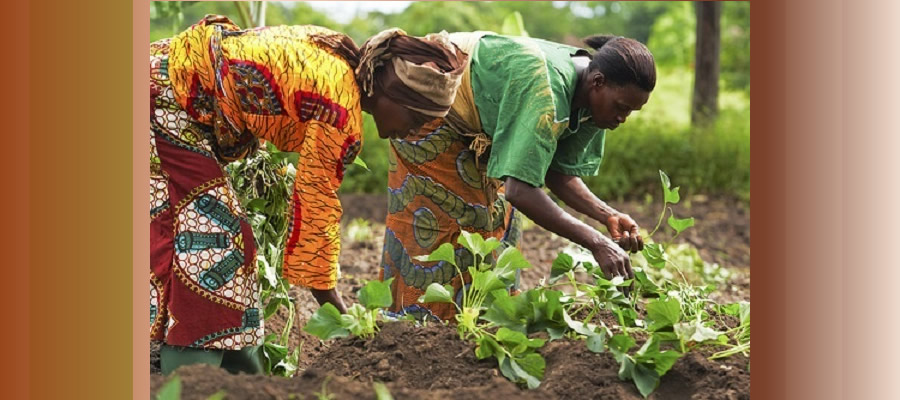
Table 4.3 shows that, the majority of the population 15 years and older in the district are skilled agricultural, forestry and fishery workers (73.1%). It also shows that about 11.6 percent are craft and related trade workers. The proportion of the male population engaged as agricultural, forestry and fishery workers (78.4%) is higher than that of females (68.7%). On the other hand, the proportion of females (16.4%) engaged in craft and related trade work is more than double that of males (5.9%). The proportion of the female population engaged as service and sales workers is 10.2 percent compared with 4.9 percent of males in the district.
Date Created : 4/10/2018 7:40:09 AM


 facebook
 X
X
 Youtube
 instagram
 +233 593 831 280
 0800 430 430
 GPS: GE-231-4383
 info@ghanadistricts.com
 Box GP1044, Accra, Ghana