
Water security
Access to portable Water
The major sources of water used by households in the District are pipe schemes, boreholes, rain water, rivers, hand-dug wells, dams and dugouts. The largest proportion of households (33.7%) gets their main source of drinking water from boreholes/pumps/tube well. There are other notable sources including pipe-borne outside the dwelling (12.9%), public tap/standpipe (4.7%), harvested rain water (2.9%), and protected wells (0.4%). Only 2.7 percent of households have pipe-borne water inside dwelling.
However, the use of unprotected well (1.0%), unprotected spring (1.3%), dugout/pond/lake/dam/canal (1.0%) or river/stream (18.3%) collectively recorded 21.6 percent in the district. The proportions for these four sources are 25 percent and 12.5 percent of the rural and urban localities respectively.
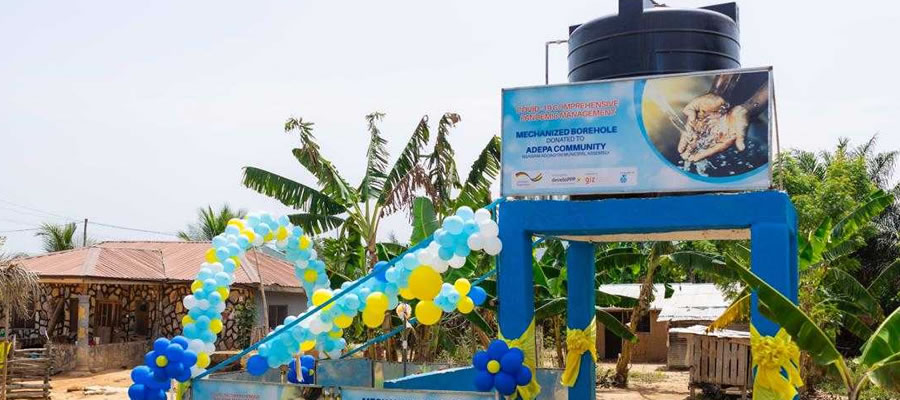
In an effort to improve upon people’s access to potable water, the Assembly has collaborated with a number of development partners in the provision of potable water in the District. Currently, there are 77 boreholes across communities in the district with only 54 of them functioning.
Community ownership and management is also being promoted to enhance the sustainability of existing water facilities. Communities that have benefited from some form of water infrastructure, especially boreholes are being trained and provided with basic tools and equipment to undertake regular servicing and maintenance of their water facilities.
Figure 2: Water Facilities Map
Sanitation Facilities & Method of Waste Disposal
With increasing population and industrialization, waste management is becoming a severe problem in Ghana. Proper means of waste disposal is crucial to public health and the environment. This helps reduce the chances of spreading diseases. Proper waste disposal also reduces the probability of contamination of the soil and groundwater.
The 2010 PHC result revealed that 57.5 percent of household dispose their solid waste at public dump (open space), 17.1 percent burn their solid waste, while only 8.3 percent dump their waste indiscriminately. On the other hand, only 1.9 percent has their waste collected, 8.3 percent uses public container while 6.1 percent buried their waste.
By type of locality, while the proportion using of open space in the rural areas is 37.3 percent, that of the urban areas is 20.2 percent. The proportions using public dumps (containers) are 5.8 percent in the urban areas and 9.2 percent in the rural areas.
On liquid waste disposal, majority of households (24.9%) have their waste thrown onto the compound while 34.0 percent throw their waste onto the street. Relatively small proportion practice more improved system (through the sewerage system [1.6%], through drainage system into a gutter [5.2%], through drainage into a pit/soak away [2.2%], and thrown into gutter [18.4%]).
By type of locality, 53.1 percent of households in the rural areas throw their liquid waste onto the compound as compared with 31.6 percent in the urban areas. Currently there are 15 public toilet facilities owned and operated by the Assembly with two of the being water closet ones.
Date Created : 11/23/2017 2:52:36 AM


 facebook
 X
X
 Youtube
 instagram
 +233 593 831 280
 0800 430 430
 GPS: GE-231-4383
 info@ghanadistricts.com
 Box GP1044, Accra, Ghana