
Purpose of the Monitoring and Evaluation
Nkoranza South Assembly has evolved a new Medium-Term Development Plan (MTP) under the Ghana Shared Growth Development Agenda (GSGDA) 2010-2011 to guide development efforts in the district. This Annual Progress Report (APR) is an assessment of progress made towards attaining the targets set out in the seven thematic areas of the GSGDA. This assessment is done through evidence-based information on selected core indicators.
The Annual Progress Report reviews the current status of actions taken on the implementation of the Medium Term Development Plan in 2009. The report compiles achievement levels of the assessment of a set of indicators and targets adopted for monitoring and evaluation. The output is to highlight challenges of implementation and identify interventions for poverty reduction and development in the Municipality.
Process Involved
Data input for the preparation of this report was obtained mainly from Assembly Decentralized Departments and Agencies and information generated from the field. The data collected were related to the assembly core indicators outlined in the Assembly Monitoring and Evaluation Plan.The collated data were validated at a DPCU meeting with other stakeholders. The meeting afforded stakeholders to provide explanation to achievements and failures from which lessons were drawn to improve performance. The validated data were then analyzed to inform decision making and implantation. The output of the data analysis is this report which is disseminated to DPCU members, Assembly actors, NDPC, Regional Coordinating Council and other relevant stakeholders.
Difficulties Encountered
The preparation of this Annual Progress Report encountered problems which were not different from those identified during the preparation of the Monitoring and Evaluation Plan and previous Annual Progress Report. Among the difficulties were:
- Lack of or inadequate data from the Decentralized Departments and agencies
- Inconsistencies in some data supplied
- Some data not having baseline or current data to compare
- Inadequate financial and human resources to conduct monitoring and evaluation activities in the municipality
- Non-submission of reports to the Assembly by Departments and Agencies
Monitoring & Evaluation Activities Report
Program / Program status for the year - 2009
The Assembly undertook a number of projects over the years. The analysis below covers those projects completed and paid for in 2008 and those started in 2009. Table 2 indicates progress of Development projects.
Update on Disbursements
An update of total revenue receipts for the first, second, third and fourth years of implementation of the DMTDP reveals that some progress has been made in revenue generation and receipts. The first year of implementation (2006) recorded a 41.2% increase over the 2005 total receipts of GH¢676,681.45. The second year also recorded 27% increase over the 2006 figures. The third year, 2008 recorded a drop in revenue by 30% over the 2007 figures. However, 5.5% increase was recorded in 2009 over the 2008 figures
The modest performance has been due to increased disbursements from Central Government, donor grants and improved revenue mobilization efforts.
Although, the Internally Generated Fund (IGF) has been increasing steadily between 2005 and 2007, it did not record significant gains over the period. The total IGF between 2005 and 2008 represents 18.5% of the total revenue receipts over the same period. The DACF maintained a significant lead among the sources of funding available to the Assembly between 2005 and 2008. The DACF recorded 40.2% of the total receipts over the period.The Assembly needs to step-up its local revenue generation efforts to augment GoG grants and donor support. Table 2 and figure 1 show revenue receipts between 2005 and 2008.
Comparing DACF to IGF 2005 -2009
Table 5 indicates the IGF as a percentage of the DACF between 2005 and 2009. It shows increased revenue generation over the first three (3) years from 25% in 2005 to 34% in 2006 and to 89% in 2007. However, it dropped from 89% in 2007 to 44% in 2008. The year 2009 recorded a further drop in the IGF from 44% in 2008 to 34% 2009. Table 4 also indicates that the IGF contributed only 18% of all revenues generated in the plan period 2006 to 2009. This is indicative of poor revenue generation in the district. The Assembly over relies on the DACF which contributed 42.3% of total receipts of the same period.
The sharing of the DACF takes into account the revenue generation performance of DAs, the drop in the municipality share of GH¢268,179.52 from GH¢496,731.69 in 2006 was not anticipated. The table also indicates that the overall performance of revenue generation in 2008 was poor as compared with its achievements in 2007
Release of Funds
Inflows to the Assembly have not been regular as expected. This accounts largely for the implementation delay of programs and projects and suspension of planned programs within a period. The fourth quarter’s allocation of the DACF for instance is released in the first quarter of the ensuing year.
Efforts to Generate Funds
As already indicated, the DACF remains the leading source of revenue to the Assembly for development programs. In this vein, delay in the release of the DACF largely affects execution of programs and projects. To correct this imbalance a number of measures have been put in place to increase local revenue generation. They are:
- Valuation of all land properties to ascertain their real values for appropriate levies
- Recruitment additional of revenue collectors
- Training of revenue collectors
- Expansion of revenue items to cover all those that were not hitherto levied
- Provision of needed logistics for revenue collection, monitoring and enforcement
- Prudent financial management and
- Expansion of market infrastructure
Challenges of Revenue Generation
Revenue collection at the local level is confronted with a number of challenges including:
- inadequate revenue collectors
- logistical constraint
- general apathy towards tax payments
- under declaration of ratable items/properties
The Assembly is developing strategies to minimize the effects of the challenges on revenue generation.
NKORANZA SOUTH MUNICIPAL ASSEMMBLY
Project/Programme Status for the Period January – March, 2010
This project report covers the status of development projects and programmes in the Nkoranza South as of 31st March, 2010. In total the report covers twenty-three (23) projects. Table 4 indicates current progress of development projects. The purpose of the report is to keep track of project and identify implementation challenges and the way forward.
Location of Projects
Out of the twenty-three (23) projects listed in Table 4, fourteen (14) of them, representing 61% are located in the capital Nkoranza, while the remaining 39% are distributed outside the capital. The spatial distribution of projects skewed to the capital was mainly due to the incessant demand for infrastructure by the capital arising out of urbanization and its attendant pressure on social amenities. It is also an attempt to give the capital a face-lift in its preparation for a municipal status.
Sectoral Spread of Projects
Education takes the chunk of the total investment within the period (44%). Administration trails education sector with 26%. The remaining 30% (7 projects) are fairly distributed among Social, Energy and Health Sectors. Table 1 shows sectoral spread of listed projects.
Pace of Work
The 23 projects listed are within their expected periods of completion, except one which is slightly behind schedule, (i.e Renovation of Old Assembly block judicial offices). One of the projects initiated under the Ghana @50Celebration (No. 15) had been abandoned by the contractor apparently for the fear of non-availability of funds since the anniversary celebration had ended. The Assembly is to track the the funding source for funds and get back to the project.
Source of Project Funding
The listed projects are funded from District Assemblies Common Fund (DACF), Donors and Central Government sources. The DACF however emerges as the main financier of development projects in the district paying for 52% of all investments as indicated in table 2 below. About 17% of the investments are sponsored sorely by donors, with the highest coming from Community-Based Rural Development Project (CBRDP).
About 13% are co-sponsored by Donors and DACF and about 17% sourced from central government (GETfund).
NKORANZA SOUTH MUNICIPAL ASSEMBLY
DDF PROJECT STATUS FOR THE PERIOD ENDING MARCH, 2011.
This project report covers the status of on–going Development Facility (DDF) Projects in the Nkoranza South Assembly as of March, 2011. In total, the report covers nine (9) projects and Design /Supervision consultancy activities. Table 2 indicates progress of DDF Development Projects. The purpose of this report is to help track project progress and identify implementation challenges and the way forward.
Location of Projects
All the nine (9) projects listed are evenly spread across the District. The district capital was not included in the list of beneficiary communities in view of the other interventions being executed there. The selection of the communities was made to address the felt needs of those areas.
Sectoral Spread f Projects
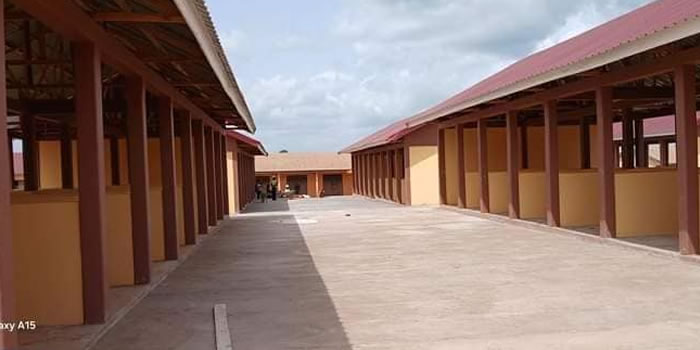
All the nine (9) projects listed are education sector infrastructure. The distribution of all the projects is skewed 100% to education sector to solve the urgent need for school building in these rural communities.
Pace of Work
All the nine (9) investments were within their expected period of completion. Work was going on in earnest at all project sites during the period under review.
Source of Project Funding
The listed projects are funded from the Investment Component of the Development Fund (DDF). However, the Assembly altered the original design of two of the projects located at Pruso and Brahoho from 2-unit to 3- unit Classroom Blocks. Again, the contract figures which emerged as winners of the bids were above the estimated allocation of the projects. The Assembly is to top-up the DDF budget to the tune of GH¢104, 582.49 as detailed out in the table attached.
Payments
The total cost of the nine (9) projects and consultancy fee sum up to Five Hundred and Thirty-Seven Thousand, Three Hundred and Seventy-Four Ghana Cedis, Fourty -One Pesewas (GH¢ 537,374.41). Out of this contractual commitment, an amount of Three Hundred and Fourty –Six Thousand, Three Hundred and Ten Ghana Cedis, Fourty-One Pesewas (GH¢ 346,310.41) had been paid, representing 64. 4% of the total investment cost. An amount of One Hundred and One Hundred Ninety-One Thousand, and Sixty-Four Ghana Cedis (GH¢ 191,064.00) representing 35.6% remained unpaid.
Payment Levels of Investment
Payments made (GH¢) 346,310.41 64.4%
Outstanding payments (GH¢) 191,064.00 35.6%
Total payments made within the reporting period (January – March, 2011) sum up to GH¢ 260,555.96.
Observation/Ways Forward
It was observed that work was going on in earnest at all the sites and no difficulty or problems were reported on sites. The pace if kept in motion will see the successful completion of projects on schedule.
Date Created : 11/17/2017 6:56:47 AM


 facebook
 X
X
 Youtube
 instagram
 +233 593 831 280
 0800 430 430
 GPS: GE-231-4383
 info@ghanadistricts.com
 Box GP1044, Accra, Ghana