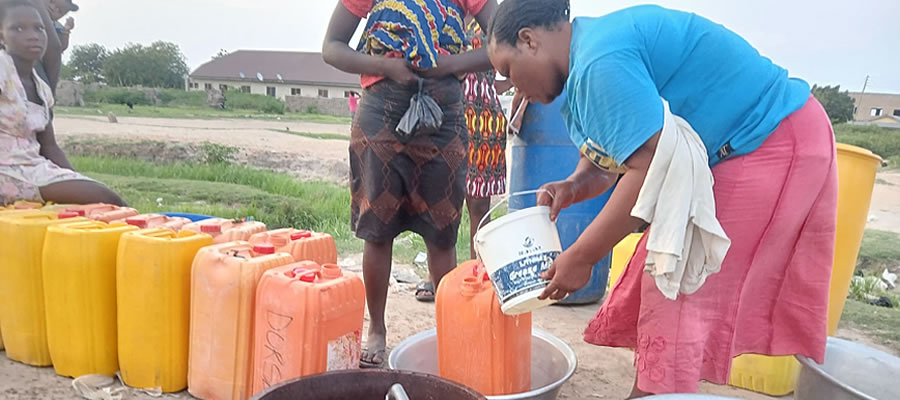

WATER COVERAGE
According to the 2010 Population and Housing Census there are six (6) main sources of drinking water for dwelling units in the District. These are Public tap/Standpipe (63.1%), Pipe borne outside the dwelling unit (19.9%), Sachet water constitutes (7.2%), Pipe-born inside the dwelling unit (4.7%), Dugout/Pond/Lake/Dam/Canal also form (2.2%) of the main water source use, and Borehole/Pump tube well (1.5%).
In the urban locality more dwelling units use public tap/standpipe (69.6%) compared to 60.3% used in the rural areas. 21.0% of rural dwelling units use pipe-borne outside dwelling than in the urban locality (17.5%). Besides, more dwelling units in the urban locality use sachet water 10.5% compared to rural dwelling units sachet water use of 5.7%. The use of Dugout/Pond/Lake/Dam/Canal is 3.1% in rural dwelling units with 0.0% use in urban communities in the district
ENVIRONMENTAL SANITATION
Environmental sanitation is aimed at developing and maintaining a clean, safe, and pleasant physical and natural environment in all human settlements, to promote the socio-economic and physical well-being of all sessions of the population.
Baseline data on environmental sanitation shows that households in the District still rely on improper waste collection and disposal methods. Most settlements in the District are without organized refuse disposal sites. Domestic rubbish (solid waste) is disposed off indiscriminately in areas surrounding residential houses. The District depends on refuse trucks belonging to the Zoom Lion Company Ltd for the waste management. Potentials for urbanization and non-adherence to planning schemes leading to unauthorised construction of buildings along flood plains and creation of slums in the District are the eminent challenges with sanitation.
Status of Solid Waste Management
Poor solid wastes management with its immediate and visible impact remains a daunting task for achieving a healthy environment. Based on the 2010 Population and Housing Census, the District population is estimated at 59,124 and the residents generate an estimated average of 0.2 Metric Tonnes of solid waste daily which is translated into 67.2 Metric Tonnes annually.
From the 2010 PHC, only 9.6% of households have their waste collected from their dwellings, 29.7% of the household have their waste burnt, 39.4% use various household receptacles for storage which are send to the designated public dump( open space). Incidentally only 6.5% of the household send their solid waste to the public containers for disposal. The data also indicates that 3.3 % of households bury their waste while 10.5% of households dump at unspecified locations including drains, embankment of water courses and wetland
Composition of Solid Waste
Solid wastes in the district are derived from various sources including domestic activities, commercial activities, industrial, health care, and other agricultural activities. The major components of solid waste generated in the district are mainly from organic source and it accounts for 45% of all waste generated followed by plastic waste also accounting for 33. % as indicated in the table below.
Waste Management
The communal containers are woefully inadequate. In most of the communities, they do not have access to well organize waste disposal and therefore many resort to indiscriminate solid waste disposal and sometimes burnt them. This leads to excessive fly breeding and smoke nuisance within the communities.
Liquid Waste Management
Main Type of Toilet Facilities Used by Households
One of the major challenges confronting the Ada West District in liquid waste management is the open defecation in most communities. According to the 2010 PHC 58.4% of the households in the district use open defecation as the most popular method of human excreta disposal and this is more pronounced among rural household (69.7%). This is a practice that is more common among the poor and those with relatively low levels of education. Only 18.5% of household use the public toilets while 11.03% of household use KVIP and only 5.0% of the households have access to Water Closet toilet and house household that use and Pit latrine is 4.4%.
Inadequate disposal of human excreta and personal hygiene is associated with a range of disease including diarrhoeal diseases and polio. It is estimated that improved sanitation can reduce diarrhoeal disease by more than a third, and can significantly, lessen adverse health impacts of other disorders responsible for death and disease among children. Ghana Statistical Service classified improved sanitation facilities for excreta disposal to include flush or pours flush to a piped sewerage system, septic tank, or latrine, Ventilated Improved Pit latrine (VIP), pit latrine with slab and composting toilet.
Data from Multiple Indicator Cluster Survey (2011) indicates that the use of improved sanitation facilities is strongly associated with wealth and educational level of head of household. The use of public toilets is very high among rural households (73.4%) than urban households (26.6%). The proportion of households that have no access to toilet facilities is more for the rural locality (69.7%) than in the urban household (30.25%). One striking though encouraging situation is that among the household that use of W.C.in the district, 89.4% of the households are in rural communities while only 10.6% are in the urban areas.
The District has no reliable cesspit emptier for dislodging human excreta. Unfortunately too, there is no approved final disposal site for depositing liquid waste. The dislodging at unapproved places exposes the district to health risks. The lack of well managed storm water and sullage drains in the inland communities contributes to the presence of pool of stagnant water. This environment provides breeding ground for mosquitoes in the community accounting for the high cases of malaria in the district in the raining season.
Date Created : 11/17/2017 5:27:11 AM


 facebook
 X
X
 Youtube
 instagram
 +233 593 831 280
 0800 430 430
 GPS: GE-231-4383
 info@ghanadistricts.com
 Box GP1044, Accra, Ghana