

Population Size and Growth
The total population of the District in 1984 was 81,828. However, the population of the district in 2000, according to the 2000 population and housing Census, is 133,632 representing about 3.7 percent of the Regions total population of 3,612,950. The current projected population of the district is 160,495. Males constitute 55.2 percent and females represent about 44.8 percent. The sex ratio stands at 123.2 males to 100 females. Using 1984 population as the base year, the annual growth rate is estimated at 3.1 percent. This growth rate is considered to be high as compared to the regional rate of 2.5%. This high growth rate is largely due to natural factors (high fertility rate and low mortality rate and low mortality rate) and migration.
Population Distribution
The District is predominantly rural with over 160 organised settlements. The district has a population of 133,632 (2000 population and housing census) of which 48.2% live in the 20 larger settlements. The 20 larger settlements are mainly located on the Kumasi-Sunyani, and Mankranso-Tepa major roads. The population is dense along these two major corridors. Out of the over 160 settlements, only three namely, Sabronum, Adugyama, and Mankranso have a population of over 5000. This constitutes 13.4% of the district’s total population. Twenty-five other settlements have population ranging between 1000-5000. The less accessible areas are sparsely populated.
Reasons for Difference in Population
The reasons for the uneven distribution of population in the district are:
Availability of socio economic infrastructure such as:
- Electricity
- Market
- Access road
- Education
- Health centres/clinics & potable water
Availability of viable land for farming activities
The nature/origin of the community: The size of the population also depends on the nature of the community. The size of the population is invariably high in indigenous communities as against the settler communities. This accounts for a high population of over 7000 at Sabronum, with Wioso, Mpasaso 1&2 and Domiabra each having more than 3000.
Consequences of Differences in Population Distribution
Densely populated areas tend to attract more facilities to the detriment of the sparsely populated areas. This situation leads to migration from the smaller communities to the bigger ones. Core periphery relationship is therefore created thereby widening the gap between the densely populated and sparsely populated areas.
Population Density
Ahafo Ano South West District has a total land area of 1241 sq. km. However, the population of the district keeps on increasing at an alarming rate over the years. The population density of the district in 1984 was 65.9 per sq. km. This figure increased to 77.1 and 90.0 in 1990 and 1995 respectively. The population density for 2000 is 107.2. However, the estimated density for 2006 is 129.3 Table 3 Shows the population density over the years.
Though the district is not over populated in terms of the number of people per square Km, it has a fast growing population. The rapid growth is the result of natural increase-high birth rate and a considerable reduction in the mortality rate. The growth rate is putting increasing pressure on the district’s limited social infrastructure and other resources. It is therefore imperative to realize the importance of population programmes to balance the size of population with available resources.
Household Characteristics
A household consists of a person or a group of persons, who live together in the same house or compound, share the same housekeeping arrangements and are catered for as one unit. The district has an average household size of 7. This figure is larger than the national average of 5, an indication that population management programmes have had little or no effect on the district’s demography. The households are mainly headed by men.
In the district, 54.8% (100,530) of households claim ownership of the dwelling units they occupy, while about 35.2% live in rented premises either for free or for a fee. Only 1.3% (252) of households live in dwellings, which are public property, while private employers own 5.7%. (Source: 2000 population and housing census) Given that the average household of 7 is a mix of parents (head of household with or without spouse) children and other relatives, the ideal situation would be an average of 3 rooms per household. However, the existing situation in the district provides a picture of overcrowding or inadequate sleeping rooms, particularly when personal property occupies a sizeable portion of the sleeping room(s).
According to 2000, population and housing census report, Kerosene lamp is the main source (92%) of light for the households in the district. Only 6% of the households use electricity and the remaining 2% depend on other sources of light.
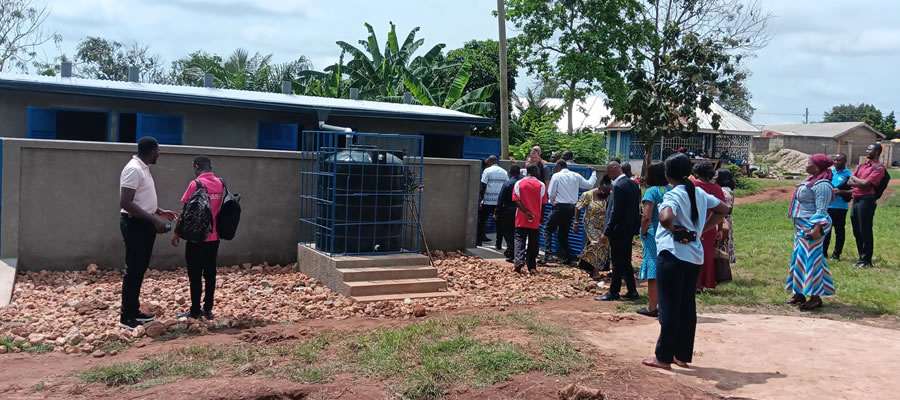
According to the report, 1.7% of the households have access to pipe-borne water, while 55% depend on hand dug well and bore holes. The remaining 43.3% of households depend on natural water sources like rain water, streams and ponds. The picture of toilet facilities in the district is unsatisfactory, only 0.7% of households have facilities provided in or around the house and in most cases are shared with other households in another house. For the rest of the households, 90% use public facility, while the remaining 9.3% of households have access to no specified facility. The major source of cooking fuel to the households is fuel wood. About 90% of the households depend on wood, while the remaining 10% depend on other sources.
Age and Sex Composition.
About 47 percent of the district’s current population falls within 0-14 years whilst 15-59 constitute 40.5%. The aged i.e. 60 years and above, form 12.5%. This shows a high dependency ratio of 1:1.5 (refer to population pyramid). This is a major cause of rural poverty and deprivation as several households are unable to meet their basic needs such as food, health, education and clothing. Another implication of the youthful population is it’s potential to grow rapidly. It also calls for increasing demand for social facilities such as schools and health. Table 4 shows projected age distribution by sex for 2002.
Population Distribution
The District is predominantly rural with over 160 organised settlements. The district has a population of 133,632 (2000 population and housing census) of which 48.2% live in the 20 larger settlements. The 20 larger settlements are mainly located on the Kumasi-Sunyani, and Mankranso-Tepa major roads. The population is dense along these two major corridors. Out of the over 160 settlements, only three namely, Sabronum, Adugyama, and Mankranso have a population of over 5000. This constitutes 13.4% of the district’s total population. Twenty-five other settlements have population ranging between 1000-5000. The less accessible areas are sparsely populated.
Deprived Areas of the district based on location of facilities and service such as Electricity, Public Administration, Senior Secondary, and Health Centres;
- Krantori Area Council
- Bone Area Council
- Domiabra Area Council
- Vast Sections of Asuobiem and Dwinyanbiem Area Council
- Sabronum and north eastern part of Pokukrom Area Council
- Western part Abesewa Area Council-Ogyabedibi Ogyam etc.
Underlying Factors
- Apathy
- Smaller size of populations in various settlements
- Limited resources for development
- Inability to Pay matching fund for most donor sponsored projects.
Implications for Poverty
The absence of socio-economic infrastructure which are catalyst for growth and enhancement has worsened the plight of inhabitants of these communities, thereby increasing the poverty levels in the affected areas.
Key Production Centres
Agriculture is the mainstay of the districts economy.
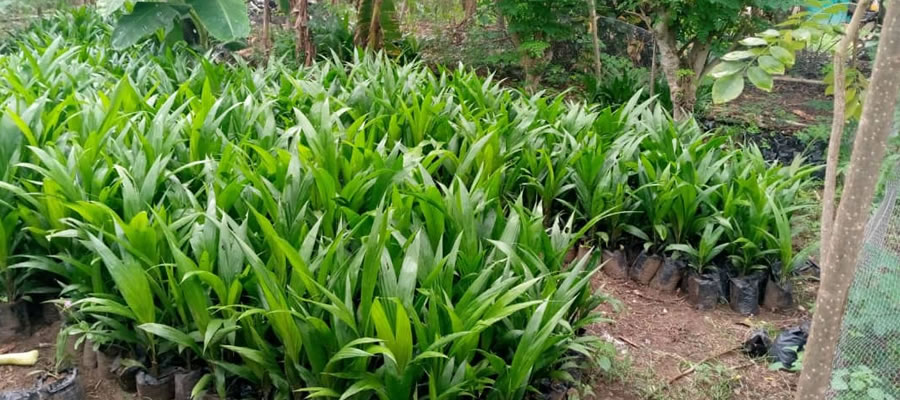
Economic activities are therefore very low with farming as the most important productive activity with respect to output, income and employment. Cash crops, such as cocoa, citrus oil palm and food crops like plantain, cassava, cocoyam, maize and vegetables (tomatoes and okro) are the main agricultural produce in the district.
Scalogram Analysis
The scalogram analysis (Table) shows the hierarchy of settlements in the district. The sphere of influence of the existing facilities with the exception of the weekly markets at Kunsu, and Adugyama are limited. This is attributed to poor accessibility, high cost of transport and other services particularly health care. Secondly, each of the ten (10) area councils is supposed to provide certain levels of basic services to its surrounding communities. However, these centres lack basic facilities and are therefore unable to provide the required services.
This is because the population of most area council headquarters fall below 5000 and provision of services is usually based on population thresholds. Most settlements especially those on Kumasi-Sunyani Highway,depend considerably on Kumasi for goods and services because of easy accessibility. The Selection of twenty largest communities for scalogram analysis was based on 2000 Population and Housing census report.
The following facilities, postal Agency, Police Station, Banking, Clinic, Electricity, weekly market second cycle school, court, Administration, piped system, Telecommunication systems were used in the scalogram analysis. The frequency of facilities such as Primary and Junior Secondary Schools boreholes and chemist shops was very high (i.e. present in all the 20 and 15 communities respectively). However, facilities such as Senior Secondary School, Court, health centre Administration, electricity have limited frequencies.
Implications for future interventions
The above analysis implies that, in our future development efforts, more facilities and services should be sent to the less endowed areas/communities to ensure a balanced spatial The scalogram analysis (Table 11) shows the hierarchy of settlements in the district. The sphere of influence of the existing facilities with the exception of the weekly markets at Kunsu, and Adugyama are limited. This is attributed to poor accessibility, high cost of transport and other services particularly health care. Secondly, each of the ten (10) area councils is suppose to provide certain levels of basic services to its surrounding communities. However, these centres lack basic facilities and are therefore unable to provide the required services.
This is because the population of most area council headquarters fall below 5000 and provision of services is usually based on population thresholds. Most settlements especially those on Kumasi-Sunyani Highway depend considerably on Kumasi for goods and services because of easy accessibility. The Selection of twenty largest communities for scalogram analysis was based on 2000 population and housing census report.
The following facilities, postal Agency, Police Station, Banking, Clinic, Electricity, weekly market second cycle school, court, Administration, piped system, Telecommunication systems were used in the scalogram analysis. The frequency of facilities such as Primary and Junior Secondary Schools boreholes and chemist shops was very high (i.e. present in all the 20 and 15 communities respectively). However, facilities such as Senior Secondary School, Court, health centre Administration, electricity have limited frequencies.
Development Nodes
The analysis of the scalogram shows a very weak growth centres which provide little or no service to the outlying population. The functional hierarchy of settlements further revealed that apart from Mankranso, the district capital, which emerged as a first order community, with a centrality score of 522, there was no second order community in the hierarchy.
The following communities: Dwinyama, Pokukrom, Kunsu, Sabronum and Wioso, however, emerged as 3rd order communities within the functional hierarchy. In order to speed up the pace of development of the district, the following communities have been proposed as development nodes/growth poles: Wioso, Pokukrom, Sabronum, Dwinyama and Kunsu.
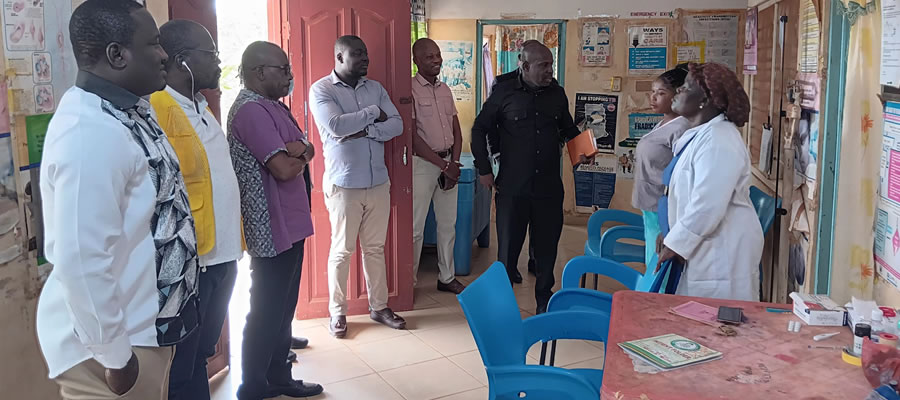
Dwinyama and Kunsu which are market centres and are near the district capital were selected as development nodes to strengthen and extend the trickling down effects of the capital. The communities without electricity- Pokukrom, Wioso, Sabronum should be connected to the national grid. The health facilities in these localities should be upgraded to enable them serve and win the confidence of their catchments areas. The schools in these communities should be turned into model or demonstration schools with adequate teaching and learning facilities to enhance education and long run development of the localities.
The District Assembly should set up small scale industrial support fund and assist prospective small scale industrialists to set up business in these communities. Weekly markets should be developed and sustained in these communities to make them economically viable. The communities must therefore be given the needed development support to enable them propel the development of the surrounding communities.
Date Created : 11/15/2017 4:00:25 AM







 facebook
 X
X
 Youtube
 instagram
 +233 593 831 280
 0800 430 430
 GPS: GE-231-4383
 info@ghanadistricts.com
 Box GP1044, Accra, Ghana