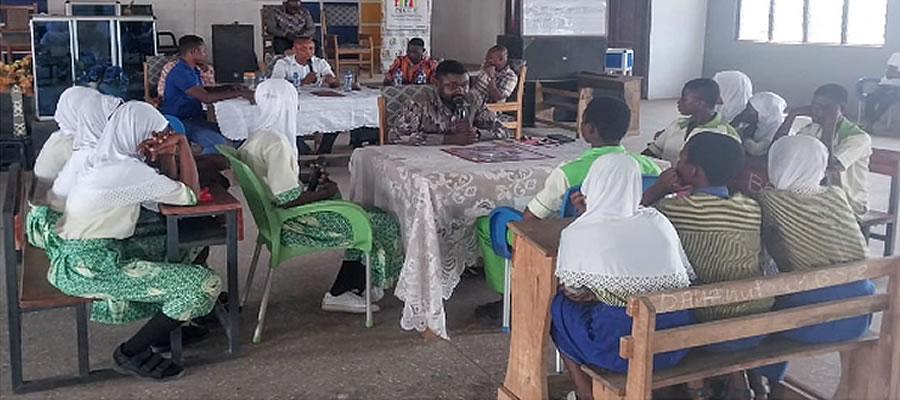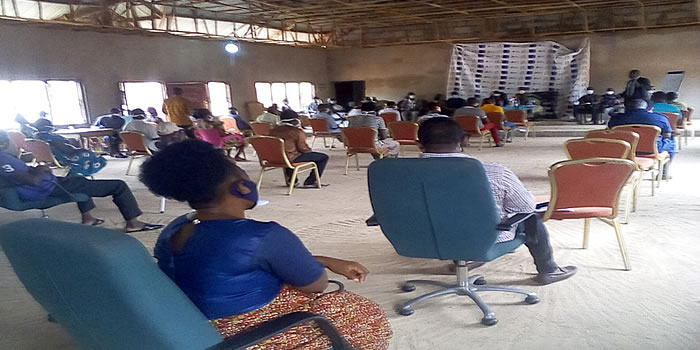

Formal Education
Number and Ownership of Schools
From the survey, there are a total number of 167 educational institutions in the District, out of this number, 63 are pre-schools, 63 primary schools, 38 Junior High Schools and 3 Senior High Schools. Of 167 schools in the District, 131 are public schools and 36 are privately owned.
Table 9 - Numbers of Schools/Educational Facilities and Ownership
Source: GES, Jema, 2018
Figure: School ownership in the District
Source: DPCU, 2018
From the table above it could be seen that the total number of public schools in the District stood at 131 representing 78% of all schools in the District and 36 schools are owned by private individuals representing 22%. The analysis shows that the public sector contributes much more in the provision of schools in the District than the private sector. This situation can be attributed to huge investment that comes with the provision of educational infrastructure.
Enrolment Levels This section gives the present situation with regards to the total number of pupils/students in the various level of education in the District. The enrolment rate –generated from enrolment levelmeasures the number of persons who are supposed to be in school and are in school. It was revealed that the entire enrolment for the district from K.G to SHS stood at 18,387 with males at 9,561(52%) whiles the females were 8,825 (48%). Generally males enrolment outweighed that of the females in public schools, however at the K.G level, females population was more than males population. This therefore means that more females drop out of school at the K.G level before they get to primary school. At the SHS level, the male enrolment went as far as 55% whiles that of the females was 45%. Management and stakeholders has to look at proactive measures that will ensure retention of the girl child at school.
Table 10 - Total Number of Schools and Enrolment for Public Schools
Source: GES, 2018
Figure: School enrolment in the district
Table 1.20 Total Number of Schools and Enrolment for Private Schools
Number and Staffing Level in Schools
The quality of teaching and learning depends largely on the proportion of the trained teachers among the teaching staff. Increases in enrolment as a result of provision of the capitation grant to all basic schools, and the introduction of the school feeding programme in selected schools have undoubtedly intensified the demand for trained teachers.
From the table below, it was revealed that pre-school has a total of 41 (10 males and 31 females) teachers serving the 49 pre-schools across the district. Out of this number 34 of them were professional and trained teachers whiles 7 were untrained. This therefore means that about 8 preschools have no teachers if all allocated one teacher each. At the primary level, the teacher strength stood at 231 (137 males and 89 females), out of the number, 171 were trained and 60 were not. The JHS level also had a total of 162 teachers (154 males and 8 females). About 136 were trained teachers whiles 26 were untrained. The two public SHSs had a staff strength of 79 (75 males and 4 females), 64 of them were professional teachers whiles 15 were unprofessional.
Table 11 - Staffing Level for Public Schools
Source: GES Report (2018)
From the table, it is indicated that some schools in the district are still without teachers whiles those that have teachers are not adequate. It means that stakeholders have to put up measures to staff all schools from the pre-school level to SHS.
Teacher Ratio and Gender Parity Index
The Pupil Teacher Ratio is a key input indicator used as proxy for assessing the quality of education. The associated policy objective is to achieve a national Pupil Teacher Ratio of 28:1 at the primary level and 25:1 at the Junior High School level, as these levels are expected to be optimal for ensuring quality education.
Table 12 - Pupil/Teacher Ration and Gender Parity Index
The pupil-teacher ratio in the district is 1:101, 1:37, 1:21 and 1:20 for pre-school, primary, JHS and SHS respectively. The statistics indicate that there is so much pressure on pre-school teachers since the number of pupil to handle is above the national standards. Ratio for Primary, JHS and SHS shows less pressure on schools as the figures are less as compared to the national figures.
The results reveal that the teacher – pupil ratio at all levels of education with the exception of pre-school in the district is quite favourable. There is however disparity in the allocation of teachers. Whiles rural communities are struggling for staff, the urban areas are over staff owing to the concentration of social amenities and better conditions of service.
This means that more children can, and should be enrolled in the urban areas without necessarily increasing the number of teachers. It must however, be pointed out that since the ratio is an average, specific geographic areas which are characterized by poor road conditions and poor school infrastructure still need some more teachers. There is the need for a serious drive towards increased enrolment of children of all ages.
Furniture Situation
Any policy recommendation which is geared towards increasing enrolment levels should as well incorporate the provision of furniture to commensurate with the intended total enrolment. We could establish the exact infrastructural gap within all public schools but the District Education Directorate indicated that all levels of education has inadequate infrastructural provision.
Table 13 - Availability of Furniture in Schools
Source: DPCU Report (2017)
Infrastructure Situation in Basic Schools
Infrastructure development serves as the basis to quality education at all levels. The Pru West District is still faced with a lot of infrastructural challenges across the its communities. Schools with the exception of the SHS level still seat under trees to undertake studies. From the table below, it was indicated that 16, 10 and 5 K.G, primary and JHS were not having infrastructure.
Source: DPCU Field Survey, 2018
Status of Capitation Grant and Ghana School Feeding Programme
Capitation Grant
The Capitation Grant Scheme, which was piloted in 40 most deprived regions in 2004, became fully operational in 2005. The scheme continued to be implemented to encourage participation and increase the school attendance rate. All schools had their full disbursement of the Capitation Grant for pupils in public basic schools during 2014 to 2017 academic years.
Table 15 - Capitation Grant
Ghana School Feeding Programme
The district has a total of thirteen (13) beneficiary schools are currently enjoying the programme. It was observed that enrolment levels were generally high in these selected schools. Efforts must be made to scale up the programme to benefit more schools in the District especially in the Mo areas where poverty levels are generally high.
Table 16 - Ghana School feeding Programme
Source: DPCU, 2017
The table above, showed that the District received a total of GHc842, 391.20 from 2014-2017 towards the implementation of the GSFP.
Net Admission Rate (NAR) & BECE Pass Rate
The NAR measures the total numbers of pupils/students who are admitted at the various levels of education in relation to the population who are suppose to be in school. The net admission rate for the district was 72.3%.
Table 17 - Net Admission Rate and BECE Pass Rate
Source: GES, 2018
School Performance
An aggregate grade between 6 and 30 is required to enable pupils to enter second cycle education. The district did not however have its own rate.
Table 18 - School Performance rate, 2014-2017
Source: GES, Jema
Literacy Levels
The survey conducted revealed that 57% of the population is literate while as high as 43% are unable to read and write.
Figure 2 - Literacy Levels in the District
Source: Pru West DPCU Field Survey
The high illiteracy rate has implication for development. Policies should therefore be geared towards avenues for creation of employment and developing skills for the people. Avenues should also be created to reduce illiteracy level and increase literacy through adult education and other non-formal education.
Figure 1.19: Educational Facilities
Date Created : 7/13/2023 12:00:00 AM


 facebook
 X
X
 Youtube
 instagram
 +233 593 831 280
 0800 430 430
 GPS: GE-231-4383
 info@ghanadistricts.com
 Box GP1044, Accra, Ghana