
Markets
The district has constructed a market in the district capital. It is however yet to be allocated to traders. Efforts are being made to construct additional markets in some of the viable communities in the district. The district seeks to avoid the erection of white elephant markets and therefore conscious efforts are being taken to ensure that communities that would use the facility are provided based on merit and also the availability of funds.
Post And Telecommunication
Postal services are non-existent in the District as there is no post office. Letters are sent through commercial transport. For the Telecommunication services, limited network can be obtained in some specific spots in most of the communities.
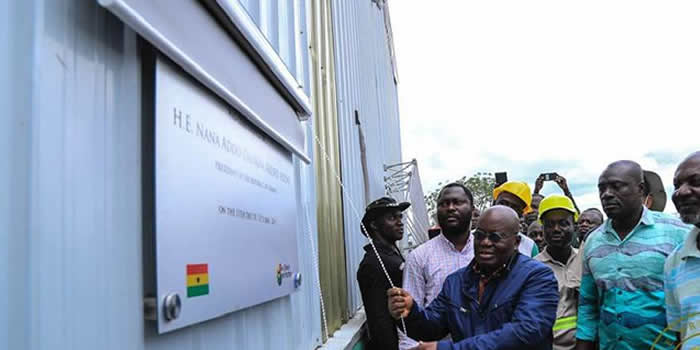
However, as part of the Ghana Infrastructure Fund for Electronic Communication (GIFEC) Project of the Ministry of Communication, three masts are being erected in three communities in the district to address the problem of limited mobile network communication in the district.
The communities are Drobonso, Anyinofi and Hamidu. It is expected the full operation of these facilities would spur the transition to the deployment of ICT oriented services in the district.
Currently, internet usage is done throughmobile phones in the face of limited telecommunication network.
Telecommunication Mast Erected under GIFEC at Drobons
Information Communication Technology
Information and Communication Technology (ICT) has become important tools in today’s knowledge-based information society and economy. The role of ICT in a lower middle country such as Ghana has been widely recognized. This recognition is reflected in actions such as the development and deployment of a national ICT infrastructure, institutional and regulatory framework for managing the sector, promoting the use of ICT in all sectors of the economy, implementing e-governance in all government institutions and the construction of a National Data Centre as well as Regional Innovation Centres (Ghana Statistical Service, 2013b).
2010 PHC included a module on ownership and use of ICT facilities as well as household ownership of fixed telephone line and computer. This chapter analyses access to these ICT facilities by various socio-demographic characteristics such as age and sex.
Ownership of Mobile Phones
Table 5.1 shows that 17,307 persons 12 years and older in the district of which 2,528 own mobile phone in the District representing 14.6 percent. This is significantly lower than the regional average of 56.1 percent.
Disaggregation of the data in Table 5.1 by sex shows that the proportion of males 12 years and older who owns mobile phone is 18.8 percent compared to 9.6 percent of the females.
Use of Internet
Table 5.1 furthers shows that there are 97 users of internet facilities throughout the District. This indicates that less than one percent (0.6%) of the population 12 years and older have access to internet. It is important to note that the proportion is far below the regional average (8.9%). The proportion of males 12 years and older who use internet facility is 0.8 percent and that of the females is 0.1 percent.
Household Ownership of Desktop or Laptop Computer
Table 5.2 presents the distribution of households owning desktop or laptop computer by sex of the head of household. Table 5.2 indicates that only 34 households in the District representing less than one percent (0.6%) own computer (desktop/laptop).The proportion of ownership is high among female headed households (1.4%) than the female headed households (0.5%).
Housing Conditions
Introduction
Housing data enables policy makers formulate realistic and relevant housing policies. It further improves upon design of appropriate programmes to meet the housing needs of the population. For instance, information on housing quality indicated by construction materials, the availability of facilities such as water and sanitation, serves as important indicators of the occupants’ quality of life. With this information, the District planning authority could design housing improvement strategies to address the standard of housing in the District.
The 2010 Ghana Population and Housing Census collected data on housing characteristics. This is to enable planning authorities know the number of structures (occupied and not occupied) within the District. Among other things, issues covered are the type of dwelling and the main construction materials used, occupancy status, methods of waste disposal, utilities and household facilities.
Housing Stock
Table 8.1 indicates that the stock of houses in the District is 5,367 with 5,411 households. It further shows a total of. The average households per house in the District is1.0 and is below the regional figure of 2.0. The proportion of population per house in the District is 5.3 and is lower than the regional average of 8.3. The average household size in the District is also 5.3 persons, which is higher than the regional figure of 4.2. It should be noted that Since Sekyere Afram Plains District is entirely rural and as such there is no analysis for type of residence.
Type of Dwelling, Holding and Tenancy Arrangements
Type of Dwelling
Table 8.2 shows that there are 5,411 occupied dwelling units in the District. However, 43.8 percent of households occupy separate houses followed by huts/buildings (same compound) (20.5%) and 19.8 percent of households reside in compound houses. The analysis reveals that households occupying makeshift and other improvised dwellings (kiosk, containers, tents, and so on and so forth) constitute less than one percent (0.4%) of occupied dwellings units. There are slight variations between male and female headed households in the district. About percent of male headed households and 40.8 percent of their female counterparts live in separate houses. Similarly, a higher proportion of male headed households (22.5%) than female headed households (10.9%) dwell in huts or buildings in the same compound. On the other hand, 31.0 percent of female headed households live in compound house compared to 17.5 percent for male headed households.
House Ownership Status
Table 8.3 discusses ownership status of dwelling units by sex of households in the district. From Table 85.3 percent of dwelling units in the district are owned by household member, 8.4 percent are owned by relative not a household member whilst 4.0 percent of dwelling units are owned by other private individual.
Main Construction Material Used For Floor
Type of materials used for the floor of a house affects the appearance, quality and sanitation issues of a house. Some floors are easily contaminated and are difficult to clean or disinfect. From Table 8.5, the two main materials used for floors of dwelling units in the district are earth / mud (52.2%) and cement / concrete (46.2%). The other floor materials for dwelling units are hardly used in the district.
Access to Utilities and Household Facilities
Main Source of Lighting
Table 8.8 indicates that almost one out of every four households (79.8%) in the District use flashlight or torch as the main source of lighting, 11.4 percent of households use kerosene lamp and 6.5 percent of households use electricity (mains). It is interesting to note that sources like gas, crop residue, candle and solar energy are almost non-existent in the District (see Table 8.8).
In comparison with the national (15.7%) and regional averages (17.3%), the proportion of households in the District (79.8%) using flashlight or torch as their main source of lighting is significantly higher. This could be explained by the fact that it is a deprived district and the capital is even yet to be connected to the national grid. It should be noted that just 354 households representing 6.5 percent has access to electricity from the national grid. These households may be living in communities closer to Kumawu.
Date Created : 11/24/2017 1:39:28 AM


 facebook
 X
X
 Youtube
 instagram
 +233 593 831 280
 0800 430 430
 GPS: GE-231-4383
 info@ghanadistricts.com
 Box GP1044, Accra, Ghana