

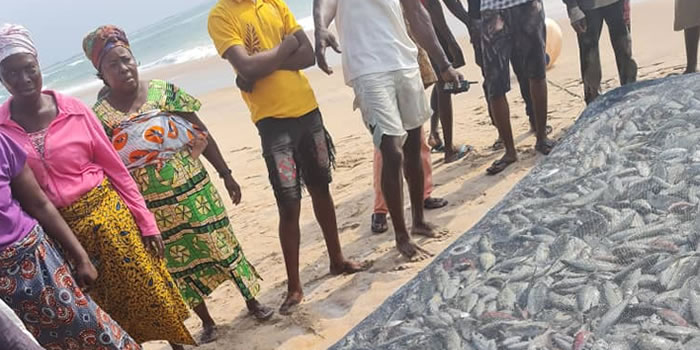
Keta Municipality is mainly an agrarian economy, with the majority of the population engaged in crop farming, livestock keeping, fishing and other agric related activities and trading. A wide range of industrial activities has been identified in the Municipality. All the industries, which are small scale, are owned and managed mainly by sole proprietors. The Keta Municipality has great potential for some categories of industries. Some of these include Ceramics Industry and Salt Production.
Investment and Business potentials
The Keta South Municipal Assembly has a lot of investment opportunities in private and joint ventureship. This is possible because of the substantial natural resources of the area. Agriculturally, the north-eastern sector of the municipality has suitable soils for the cultivation of non-traditional crops such as ginger, black pepper, cashew and also vegetables such as cowpeas, pepper and tomato.
The vast stretches of black lagoonal soils are also excellent for sugar cane cultivation, which can form the basis for a buoyant distillery. With the existence of large and small water bodies, the Keta Municipal offers excellent opportunities for aqua-culture. Labour is cheap and abundant.
The Shime and Kome areas of the Municipality are suitable for extensive fish farming activities, since the area falls under the Dry Equatorial climatic zone with a low annual rainfall of about 800mm. An irrigation project costing about ¢8 billion is being proposed for immediate implementation by the three sister districts within the region namely: South Tongu, Keta and Ketu South Municipal.
The project will boost aquaculture and increase the production of shrimps and tilapia. There is an excellent potential for the establishment of a ceramic industry at Bomigo in the Keta South Municipal Pre-feasibility reports indicate that this area has 3.2 million metric tonnes of high quality clay which can support a factory capable of producing 50 million bricks per annum for over 21 years.
The clay can also be used for an array of ceramic products, such as cups, plates, pottery, roofing and bathroom tiles. The estimated total cost of the project is ¢7.5 billion. Salt mining at Afiadenyigba, Seva, Havedzi and Nolopi is another important economic potential, of the district. Vast opportunities abound in this area of economic activity and if fully exploited, the salt requirements of the West African sub-region can be met from this Municipality.
DEVELOPMENT POTENTIALS IN KETA SOUTH MUNICIPAL
DEVELOPMENT POTENTIALS IN KETA MUNICIPAL
Type of potential | Location | Remark |
1. AGRICULTURE 1. Shrimps and brackish water species |
Angaw, Lagoon | Development for both local consumption and for export. |
2. Marine fishing
| Keta lagoon | Development for both local consumption and for export. |
3. Inland fishing | Keta Lagoon | Development for both local consumption & export. |
1.1 SOILS 1. Toje-Alajo |
| Suitable for arable crops like cassava, vegetable, cotton, mango, cashew, coconut, rice, maize tobacco. |
2. Amo-Tefle |
| Suitable for sugarcane cassava, vegetable, cotton, mango, cashew, coconut, rice, maize, tobacco |
3. Ada-Oyibi |
| A few areas suitable for pasture |
4. Oyibi-Muni association
|
| Area subject to periodic flooding and therefore unsuitable for agriculture |
5. Keta association |
| Suitable for growing coconut |
2.INDUSTRIAL 1. Clay deposits |
Bomigo | Over 15 million tones estimated. Can be used for ceramics, bricks, and tiles, both for industrial and housing projects. |
2. Salt mining/wining | Coastal stretch of the Municipality (Savietula) and Afiadenyigba in the northwestern section. | Needs revamping both technical and financial. Can be a basis for establishment of chemical industries. To be promoted for private sector investment. |
3. Crude oil | Keta basin coastal and offshore | Needs further exploration |
4. Kente Weaving | Asadame, Tsiame, Sasieme, Norlopi, Abolovi, Afiadenyigba | Can produce for local textile and tourist industries and export. |
5. Mats, hats, bag weaving | Keta, Abor, Alakple, Anloga | Can be a base for non-traditional export. |
6. Sugar cane pulp | Hatorgodo, Tsiame, (middle-belt) | Sources of raw material for the paper industry |
3. TOURISM 1. Rich tradition and culture “Hogbetsotso festival”
|
Municipal wide
| - A force in uniting the people to undertake development projects. -Main tourist asset. |
2. Tourist sites
| Whuti, Atiteti, cape st. Paul (woe), traditional military grove (Tsiame) | Employment generation and revenue mobilisation for district assembly. |
3. Fort Prinzenstein | Keta | Major tourist asset, but needs rehabilitatio |
4. Keta Lagoon |
| Major tourist asset, and needs dredging |
5. Shoreline beaches | Keta, Tegbi, Dzelukope, Woe | Major tourist asset , but needs conservation and management |
6. Birds and wet lands | Mid-western sectors of the Municipality | District should compliment the efforts of the RAMSEY project by educating students, and the communities |
4. HUMAN RESOURCE A high literate population | Throughout the Municipality | A potential labour force for the agricultural and industrial sectors |
Revenue generation activities in terms of data compilation could not be carried out despite the annual roll-overs.
Physical infrastructure improvements for selected market centres have received attention with investment in Keta, Anloga, Abor and Anyako leaving the other four markets projects unattended.
Support for viable economic groups in terms of credit facilities received little attention but self financing and tube-well sprinkler irrigation had a boost and expansion out-look.
Performance under this thematic area seems to be the main area of success in implementation despite a few roll-over activities. Education and Health infrastructure projects, water and sanitation other related programmes including capacity building, Institutional strengthening also featured very prominently within the planned period.
Accessibility in terms of road development has received little attention as most of the feeder roads are still seasonal and therefore create poor linkages amongst the various centres and movement of people and goods
especially in Shime and Atiavi areas. For the major road sector the construction of the Sea Defence 8.3km first class road linking the
Keta Municipal greatly reduced time and space gaps. Similarly, Havedzi-Afiadenyigba – Weta-Matrikasa stretch which is also the most important and the shortest link to the northern sector of the Municipal is also a new development reducing travelling time to Keta and its environs but needs to be surfaced to avoid its deterioration as it was expensive construction that greatly helped the Sea Defence Project.
In respect to sanitation management for solid waste most of the projects have not been implemented. This refers to refuse containers, Incinerators, Concrete platforms and final disposal site for solid waste
Preparing planning schemes and lay-outs for major settlements without lay-out to guide settlement planning and development control have not been implemented within the period.
Municipal finance
There are seven periodic markets in the Municipality, of which three were identified as major based on the amount of revenue collected by the Municipal Assembly and the rest of the satellite markets. These are Keta, Anloga, and Anyanui. From 2002 to date Anloga has taken over from Keta Market with the highest revenue collection as being identified as having a higher level of activity, in that the value of goods traded in at Anloga far exceeded that of Keta. Anloga alone contributes over 38.2% of all market revenues.
The low-level revenue collection at Anyanui market can be attributed to the absence of a physical barrier around the market, therefore making it difficult to monitor the collection of revenue from traders. These three major markets contribute more than 50 per cent of the District Assembly’s revenues, yet they lack adequate infrastructure. A new Anloga market, partially constructed and traders will soon be moved to the new market. The Ministry of Local Government and Rural Development under the Urban III project, E.U. Micro Projects Programme and the Municipal Assembly from its Common Fund have contributed to the construction of the new market.
The others, which are satellite markets, are Afiadenyigba, Anyako and Atiavi markets which also bring some revenue to the Municipal Assembly. It is the hope of the Municipal Assembly that these satellite markets would also grow with time. From further analysis, the Keta and Anloga markets day which happen to be the same day is not helping the Municipal Assembly in revenue generation as market women have to decide which of the markets to patronise each time. Worst still if the market day falls on Wednesday then Anyanui market also shares in the attraction and attendance.
This is a critical issue that need to be addressed passionately and tactfully for one of the two markets to precede the other to step up revenue for the Assembly as well as improving the local economy for the traders and more especially our women.Market is one major contributor to internal revenue generation in the Municipality. During the 4 year period (2002-2005) the total market revenue contribution amounted to ¢1,199,537,749 as shown in the Table 22 & 23 above. For the breakdown and analysis of revenue from the major markets in district refer to Tables 27, 28 and 29.
Revenue and Expenditure
This section deals with the analysis of the revenue and expenditure pattern of the Municipal Assembly from 2002 to 2005 with the aim of identifying areas that need intervention for the overall development of the Municipal.
Structure and Level of Revenue
An analysis of the pattern indicates that revenue comes into the Municipality through two main sources and these are internally generated revenue (local) and external.
Internal Revenue Sources
Internal here implies those generated within the Municipality. Internally, the municipal raises its revenue from various sources under (7) seven main revenue heads. Tables 25 and 26 show the internal revenue sources in absolute figures and their percentage contribution. Generally, the discounted average annual receipts for the district internal revenue, between 2002 and 2005 is around ¢616.4 million.
From Table 27 & 28, revenue collected from market tolls is the major revenue item with an average of 32.7 percent. This revenue item contributed as much as 36.6 per cent in 2003 and 37.5 percent in 2004. However, the proportions declined in 2002 and 2005 to as low as 24.00 percent in 2005. Many factors account for such fluctuations but prominent among them is the poor revenue collection and monitoring machinery and natural climatic conditions that affect farming and fishing.
Above all, Municipal in general have a poor record of mobilizing fees and user charges. This discord provides an explanation on the difficulty in local financial mobilisation. The Assembly is in difficult situation in that its major source of income is very unstable. Three other items, which showed some high averages, were exportation/waybill (33.8 per cent) 2002 to 2005, commercial operations (9.6** per cent) during the period 1998 to 2000 and revenue from the sale of licence to Akpeteshie sellers (4.1** per cent).Other items, notably rates showed fluctuations and drastic decline, which is, attributed to the lack of database on the number of eligible tax payers for the various taxable sources. Therefore, estimations are either based on guess work or receipts from the previous year.
External Revenue Sources
The external sources are revenue from the Central Government and external agencies, which are directly transferred to the district or channelled through the central government. Some of the external sources are Grants from central government, Ceded revenue, and Common Fund from Central Government as shown in Table 34 below:Refer to pdf file
Revenue from external sources in total has been increasingly consistent between 2002 – 2005 (Table 29 & 30). The major contributor in absolute terms has been the District Assemblies Common Fund. However, the Common Fund has declined substantially, in terms of percentages from 53.03 to 47.03 percent between 2002 and 2003. It increased to 50.21 in 2004 and 82.80 in 2005 (Table 30). The second major contributor is the other grants with a weighted average of 1.643 million between 2002 and 2005. Generally, the total external revenue has been increasing from 74.97 to 86.0 percent of total revenue whilst the total internal revenue dropped from 25.03 to 14.0 percent as shown in the pdf file.
The highest proportion of the District’s revenue is from external sources. The unreliability of this source negatively affects the implementation of projects and programmes in the Municipality. The Municipal Assembly should therefore increase its effort on internal revenue generation. There is urgent need to compile a nominal tax register for the Municipal.
Structure and Level of Expendicture
The Municipal expenditure has been divided into recurrent and capital expenditure:
i). Recurrent Expenditure:
The major recurrent expenditure item is personal emoluments. This expenditure item took 65.7 percent of the total expenditure for the assembly over the last four years. General administrative expenditure comprising mainly travelling and transport as well as maintenance of office equipment and miscellaneous expenditure consume almost all the internal revenue generated leaving totally nothing for development. On Table 43 consolidated recurrent expenditure has been increasing in absolute terms. Thus, 2005 show an expenditure of about 1,792,192 million as against 1,297 million in 2002 an increase of over 38 percent.
ii. Capital Expenditure:
The capital expenditure is mainly made up of constructional works of schools, markets and assisting local communities to undertake self-help projects. There has been as much as 260 percent increases in the size of capital expenditure between 2002 and 2004 and decreases to 44 percent in 2005 from the 2004 figure.
These could have arisen from a number of factors, including revenue projections, which over estimated recoveries and the failure to effect corrections over time in line with actual performance; or overspending stemming from improper control or management of expenditures.
Revenue Administration:
From the analysis, the district should have generated more revenue from its own sources. The main problem has been with recoveries resulting partly from weak revenue administrative strength in terms of collection resources:- these resources may be categorized into manpower, materials, and equipment for revenue collection. Manpower:- as a labour intensive operation, manpower is the principal input in local revenue generation.
That means matters of revenue collection, staff recruitment, training and retention are important e.g. adequacy of staff, entry qualifications and training especially on the job, number of collectors (for example an average of 52.0 percent of district revenue comes from market ticket. (However, Keta and Anloga market days coincide); high default rate especially at the Anloga and Anyanui markets is due to the absence of a physical barrier. It must be noted that the revenue collection system is currently decentralized to the sub-district level. Ineffective monitoring and control mechanism of these lower level structures and collection points is another issue, which must be addressed.
Major Problems:
The main problems of Municipal finance identified were:
. Lack of adequate and accurate data for reasonable revenue base
. Low revenue generation from own sources.
. Poor revenue projections and expenditure management.
Date Created : 11/21/2017 4:13:29 AM





 facebook
 X
X
 Youtube
 instagram
 +233 593 831 280
 0800 430 430
 GPS: GE-231-4383
 info@ghanadistricts.com
 Box GP1044, Accra, Ghana