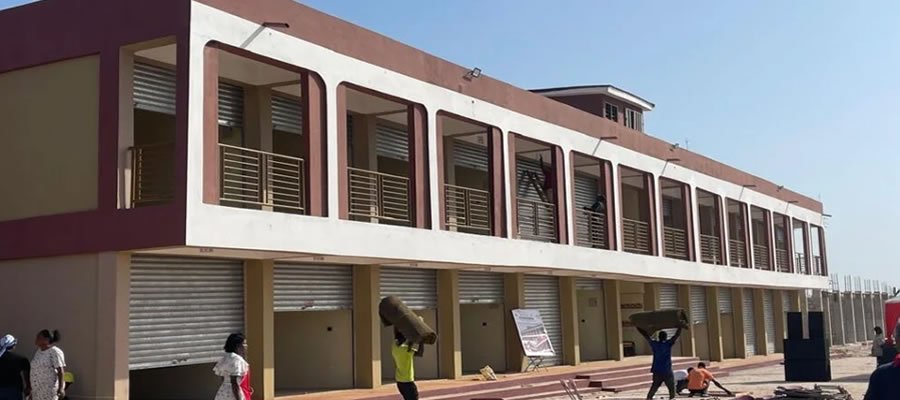

The Techiman Municipality is home of the famous Techiman Market, the largest food crop market in Ghana and a major commercial centre in the region. The Techiman Market is the hub of economic activity as well as the life blood of the Assembly’s revenue. The strategic location of the Municipality also makes it a transit point for most vehicles from the southern sector to the northern parts of Ghana and other land locked countries.
The service sector has witnessed expansion for the past three years particularly in the areas of trading, telecommunication and food and beverages retail. The establishment of the Ghana Nuts Company, the only major establishment in Techiman has provided regular employment to over 250 people.
The rural communities, however, do not appear to have experienced much improvement in job opportunities. The lack of electricity in some of these rural communities contributed to the slow pace of job opportunities. However, for those in agriculture the lack of alternative employment during the ‘low season’ has led to a high rate underemployment. The rehabilitation and development of irrigation facilities at tanoso, Kokroko and Dwena will greatly benefit farmers and create job opportunities.
Major Economic Activities
Agriculture and related trade is the main economic activity in the municipality. Table 1.7 represents the economic activity of the population by occupation. Over half of the economically active population is engaged in this activity. The major crops grown are food crops such as yams, maize, cassava, cocoyam, plantain and vegetables like tomatoes, garden eggs, onions and okro as well as cash crops like cocoa, cashew,mango,.
The soils in the Municipality favour the cultivation of major cash crops and other agricultural produce. Major production centres include;
1. Maize: Aworowa,Akrofrom, Aworopata, Asantaso, Atbuoso, Nsonkonee and Offuman.
2. Cassava: Fiaso, Forikrom, Atabuoso, Asantaso, Tuobodom, Bamire, Woraso, Bomine and Nsonkonee
3. Yam: Fiaso, Forokrom, Atabuoso, Asantaso, Bamire and Nsonkonee
4. Plantain: Mangoase, Nsuta, Woraso, Asantaso, Aworopata, Atabuoso Bonkwae
5. Cocoyam: Mangoase, Nsuta, Woraso, Aworowa, Nkwaeso
6. Groundnuts: Nsuta, Bamire, Akisimasu, Buoyem
7. Cowpea: Nsuta, Woraso, Tuobodom, Tanoboase and Tanokrom.
8. Cocoa: Mangoase, Nsuta, Buoyem, Aworowa, Tanoso, Abrika, Ateea, Asueyi, Mesidan, Offuman etc.
9. Citrus: Aworowa, Akrofrom, Mangoase, Nsuta, Nkrankrom and Malamkrom
10. Garden Eggs: Offuman, Tanoso, Adutwie, Tuobodum, Nsuta etc.
11. Potatoes: Fiaso, Forikrom and pockets of backyard production in many areas.
The predominant farming practice followed is the traditional shifting cultivation, rotational bush fallow or slash and burn. Agriculture in the Municipality is still rain fed and productivity is therefore dependant on the fertility of the soil. Although rivers criss cross the Municipality, harnessing this potential for irrigation purposes is yet to be fully exploited. The Tanoso irrigation project is however, under rehabilitation. The use of agro-chemicals for agricultural production is sometimes costly or wrongly applied.
The slash and burn system practiced in the Municipality is associated with problems including deforestation, severe soil erosion and decline soil fertility. Low soil fertility and lack of water were therefore identified as the most fundamental biophysical constraints to raising agricultural productivity in the Municipality. Farmers are also confronted with other problems like stem and grain borers, rodents and diseases such as viruses like sigatoka, rosette attacks, poor planting materials, as well as lack of access to tractor services and capital.
Investment and Business Potentials
Techiman Central Market, the largest food market in Ghana, is a ready source of supply of raw materials for agro and food-processing industries dealing in gari, yam and cassava chips,and maize grits. The market also serves as a huge buying centre for food products.
Its clientele are drawn from all over Ghana and other West African countries, such as Burkina Faso, Togo, Cote d’Ivoire, Mali and Niger. Major food items sold here include yams, maize, cassava, beans, sorghum, groundnuts and millet. Techiman Municipal is renowned for food production, as well as foodstuff commerce.
The district’s distinctively high land fertility allows for enhanced productivity in the cultivation of yams, maize, cassava, plantain, cashew, sunflower and similar crops. Indeed, the very first winner of the National Best Farmer Award hails from Techiman Municipal.
With agricultural production very high and with Techiman being a nerve centre for trading in foodstuffs, there is an ever-increasing need for the construction of storage facilities and silos to service the many farmers and agricultural produce traders. Considering the sheer production and trading volumes done, such investments would undoubtedly prove very lucrative.
Since Techiman Municipal has considerable forest vegetation, wood processing and saw milling provide another very good window of investment opportunity. The strategic position of the district ensures that both local and outside markets are available to be exploited. Brick and tile manufacturing is another outstanding area of opportunity for investors.
Indeed, the District Assembly already owns one brick and tile factory at Bomire, near Techiman town and the Assembly is inviting private entrepreneurs to join it in a private-public partnership to manage this factory. Bomire, the site of the factory, has a long and proud history of brick and tile production dating back to 1954.
Indeed, all the major drains of the village, constructed since 1954, are made of burnt clay bricks, which have stood the test of time to this day. There are huge deposits of fine quality clay, available at Bomire, Tuobodom, Krobo, Nsuta and Forikrom, which are good for bricks, tiles and ceramics.
Research documents, compiled in 1990 by the Building and Road Research Institute, are available at the District Assembly’s library for perusal by potential investors. The estimated life span of the Bomire clay deposits extends to the year 2234 from 1999.
There are government-organised Rural Technology Service and Business Advisory Centres at Techiman, which help in the training of artisans and the manufacturing of simple industrial and agricultural implements and the provision of training, advice and support for small scale private entrepreneurs.
Analysis of POCC
Potentials, Opportunities, Constraints And Challenges (Pocc)
Development is the outcome of strengths and opportunities. The team therefore examined how each of the identified strengths could be utilised to make use of the available opportunities. It also analysed how each of the strengths could mitigate the identified constraints and challenges. The summary of potentials, opportunities, constraints and challenges are therefore presented under the respective thematic areas as follows;
Municipal Assembly Finances
This section analyses revenue and expenditure of the Assembly from 2002 – 2005.
Revenue sources
The two main sources of revenue are;
• Internal Sources and
• External Sources.
Internal revenues are those collected by the Assembly using it’s own existing collection machinery. These consist of rates, lands, (excluding stool lands), fees and fines, licenses, rents, investments and miscellaneous.External sources are mostly grants from central government, royalties and other external agencies like NGOs, and donor agencies like IDA, USAID, DFID, GTZ, DANIDA, JICA, E U. etc
The revenue trend over the four – year period is indicated in table 1.9 below. Over the period 2002-2005, out of a total estimated internal revenue of ¢ 10,939,574,745 an amount of ¢ 9,064,602,587 was actually collected constituting 83% of the total projected internal revenue. Out this amount fees and fines accounted for ¢ 6,723,115,783 representing 74% of total internal revenue receipts over the period.
The estimated revenue for fees and fines over the period was ¢7,981,684,265 out of which an amount of ¢6,723,115,783 was realized, representing 84%. This indicates that fees and fines are by far the single most important internal revenue to the Assembly. It has a propensity to grow if well managed.
A further examination of the composition of fees and fines indicate that the major contributor was market tolls, especially from Techiman Market. Thus the bulk of internally generated revenue is derived from agriculture related activities, which to a large extent is dependent on natural climatic conditions. The implication is that any adverse weather condition may have serious repercussions on expected revenue. There is therefore the need to broaden and diversify the internal revenue base.
Additionally, is quite evident that markets play a very important role in internal revenue generation. Facilities at most markets are however poor. Efforts would be made to provide additional market structures and complementary facilities and services at marking centres.
Licenses recorded an actual collection of ¢ 776,161,353 representing 72% of the estimated target of ¢ 1,075,678,500. This constituted 8. 5% of the total internal revenue over the period. The potential of licenses as a key revenue source is yet to be fully exploited. Whereas a, number of economic operators are either ignorant of it, the Assembly also lacks an effective mechanism for it’s collection.
Rates recorded over the period a total collection of ¢526,941,780 (72.5%) out of an estimated target of ¢ 726,862,000. This represented 5.8% compared to total internal revenue of ¢ 9,064,602,587. From 2002 rates fell by 56% in 2003, it then sharply increased by 138% in 2004 and decreased again by 58% in 2005.
Unlike fees and licenses, rates fluctuated widely over the period. The poor performance of rates may be also be attributable to the ineffective mechanism for property rate collection and the undervaluation of properties. A re-valuation of rateable properties in the Municipality and adoption of an effective collection mechanism can greatly enhance this revenue item.
Out of the estimated total external revenue of ¢ 40,644,451,000 an actual amount of ¢ 35,111,660,709 representing 86% was realized. This constituted 79% of the overall actual revenue received by the Assembly over the period. Internal revenue constituted 21%. It must be noted however that receipts from external sources are sometimes irregular and unreliable. The common Fund which is an important source of funding was irregular over the period. Receipts from donor sources may also depend on the interest shown by funding agencies and specific projects in the Municipality. However grants receipts for salaries was regular and showed increases over the period.
Considering the erratic flow of the DACF and it’s associated restrictions regarding disbursement, both endogenous and exogenous revenue sources need to be vigorously mobilized. Advantage must be taken of the Public-Private Partnership policy of the government to explore the possibility of active private in revenue collection eg; property rate, as well as the development and management of facilities like market stores, public toilets, guest houses and water systems. Favourable conditions need to be created eg setting up of an Public-Private Partnership / NGO Desk to attract and facilitate NGO and private sector support to the Assembly. Existing links must also be strengthened with the Assembly’s development partners to expand their operations.
Expenditure
The expenditure of the Techiman Municipal Assembly is divided into recurrent and capital expenditure. The main expenditure items under the recurrent are personal emoluments, Travelling and Transport, general expenditure, Maintenance, repairs and renewals and Miscellaneous.
Capital expenditure consists of all expenditure made on development projects and programmes. This is presented in Table 1.10 above for the years 2002 – 2005. From the table, personal emolument increased from ¢1,639,516,192.00 in 2002 to ¢2,986,650,632.00 in 2005 representing an increase of 82% over the 2002 figure. For the under review personal expenditure constituted 20% of total expenditure for the four year period. However, for the year 2005, personal emoluments were 17% of total expenditure.
For Travelling and Transport, the trend indicates continued increase. From ¢407,588,205.00 in 2002 it rose to ¢1,037,287,236.00 in 2005 indicating an increase of 154% over the 2002 figure. Travelling and Transport constituted an average of 5.5% of total expenditure, over the four year period. The proportion of travelling and transport was 6% for 2005; the percentage increase from 2004 to 2005 was over 72%. This may be attributable to the general increase in the cost of travelling as well as rates of allowances. However, this expenditure sub item needs to be controlled.
Maintenance, repairs and renewals, however received a meagre 0.7% of total expenditure over the period. In 2005, this item constituted only 0.5%. This is an indication of the Assembly’s maintenance culture and the low premium placed on maintaining its assets.
General expenditure constituted 4.0% over the period. In 2005, this constituted only 3.2% of total expenditure and 38.0% of recurrent expenditure for 2005. This figure is high when viewed in efficiency consideration. Waste therefore needs to be identified and reduced in administration. Miscellaneous expenditure constituted 3.6% over the period.
Capital expenditure increased from ¢365,031,490.00 in 2002, to ¢12,291,421,489.00 in 2005. Showing an increase of ¢11,926,389,999.00. This figure however does not include receipts from donors sources. This gives a wrong impression of the Assembly’s actual capital expenditure since quite a significant amount of capital expenditure comes from donors. These need to be properly monitored and captured in the Assembly’s expenditure statement.
Capital expenditure continued to rise, demonstrating the continued injection of funds by government and other donor partners into the Municipality to support developments programmes. In anticipation of the increased development expenditures, adequate internal revenues need to be generated as counterpart funding. Part of the internally generated revenue need to be applied to development projects, to justify it’s continued payment by the people. This calls for prudent financial management.
Date Created : 11/21/2017 1:50:42 AM


 facebook
 X
X
 Youtube
 instagram
 +233 593 831 280
 0800 430 430
 GPS: GE-231-4383
 info@ghanadistricts.com
 Box GP1044, Accra, Ghana