Introduction
A District’s population size and age-sex component have broad ranging consequences for a number of socio-economic indicators such as the welfare of the people. An understanding of the age and sex structure of a population yields insight into changing population structure and highlights social and economic challenges for development. All levels of government need information on age and sex composition of the population in development planning, implementation and development and in provision of services. This chapter therefore provides information on the age and sex structure of the population of the Asutifi North District, locality of residence, dependency ratio, fertility, and mortality and migration patterns.
Population Size and Distribution
Table 2.1 shows the distribution of the District’s population by age, sex and locality of residence. According to the results of the 2010 PHC, the Asutifi North District has a total population of 52,259, which constitutes 2.7 percent of the population of the Ahafo Region. The population density of Asutifi North District is 55.81 per square kilometers.
It is made up of 26,761 males and 25,498 females. In relative terms, the male and female populations in the District are 51.2 percent and 49.8 percent respectively. As shown in Table 2.1, more males are recorded for the population of 10 years and below as the sex ratios of 102.1 and 105.1 depict the age groups 0-4 years and 5-9 years respectively. Similarly, more males are recorded for the age groups 20-24 years (88.6) and 25-29 (88.9). This may be due to the location of galamsey sites in the district. More males are however recorded in the age groups 30-39 years and 60-64 years while females also recorded higher in the age groups 70-74 years and 75-79 years (see Table 2.1).
In terms of locality of residence, the District is predominantly rural with a total of 35,468 and 16,791 for urban. Thus, more than eight out of every 10 persons in the District live in rural areas.
Dependency ratio refers to the ratio of people in the “dependent” ages (those under 15 years and ages 65 years and older) to those in the “economically active ages (15-64 years). The age-dependency is often used as an indicator of the economic burden the productive portion of a population should carry- even though some people defined as “dependent” are producers and some people in the “productive” ages are economically dependent (Population Handbook, 2011). The Asutifi North District has a total dependency ratio of 77.8. This means that for every 100 persons in the working age group there are 78 persons dependent on them. The dependency ratios for the rural and urban areas are 84.9 and 64.4 respectively. Comparatively, the dependency ratio for the district (77.8) is lower considering the region as a whole (98.2).
Age and Sex Structure
A population pyramid is a graphical representation of the age-sex composition of a population and its shape is influenced by the levels of fertility, mortality and migration. The broadness of the base is determined by the level of fertility, while the shape is determined by mortality and to some extent migration. The age structure of the Asutifi District is illustrated in the population pyramid in figure 2.1.
A population structure, in terms of age and sex shows the dynamics of population composition and highlights both social and economic challenges and opportunities inherent. The population pyramid of the district has a broad base. A large new cohort is born every year as displayed at the bottom of the pyramid (ages 0-4 years). This however, depicts extremely expansive youthful population. As the cohorts age, they inevitably lose members either through death, migration or both.
The pyramid is broad at the base and narrow at the top. This indicates that the district has a youthful population. Almost 50.0 percent of the population is under 20 years (49.8%). This has serious implication for policy planning and provision of social amenities such as educational facilities, recreational and health facilities. The situation is also likely to impact on the development of the district. This age structure depicts a built-in momentum for the growth of the population. When the young population eventually reaches reproductive age, the result will be a rapid population growth rate. However, if the socio-economic potentials of the youth are properly harnessed and directed through quality education and training, they would contribute significantly to development of the district and the nation at large.
Furthermore, the nature of the population pyramid is an indication of a thin middle age group. Under this circumstances, there are few people working to support a larger population who are under 20 years of age as well as those 60 years and older.
Fertility, Mortality and Migration
Fertility, Mortality and Migration constitute the three components of population change.
Fertility
Fertility refers to the frequency of child bearing among a population. Fertility rate measures the relative frequency with which births occur within a given population and is measured by; Total Fertility Rate (TFR), General Fertility Rate (GFR), and Crude Birth Rate (CBR). The Total Fertility Rate (TFR) which is widely used in analysis is the average number of live births per 1,000 women aged 15-49 years exposed throughout their child bearing years given that the prevailing age specific rates remain. General Fertility Rate (GFR) is the number of births in a given year divided by the mid- year population of women in the age groups 15-49 years. Crude Birth Rate (CBR) on the other hand, is the total number of births in the population (male and females inclusive). Fertility is influenced not only by age but also by factors such as marriage, health status, place of residence and educational attainment.
Table 2.2 presents information on reported total fertility rate, general fertility rate and crude birth rate for the district and the Region. Asutifi North District has a TFR of 4.3 live births per 1000 women, which means that on average every woman in the reproductive age group will have four children. The GFR is almost 127 live births per 1,000 women whereas the CBR is 31 live births per 1,000 populations.
Children Ever Born and Surviving
From Table 2.3 below, it is seen that the distribution of women aged 15-19 years (2,458) has the greatest number of females and 45-49 years age cohort also records the lowest number of females between the ages 15-49 years, with 14.3 percent and 5.4 percent respectively.
The number of children ever born per woman measures the life time and cumulative fertility performance of female in the reproductive age group 15-49 years. Table 2.3 presents information on the female population 12 years and older by age, children ever born, children surviving and sex of child. The total number of children ever born in the district is 45,799, giving an average of 2.67 children per woman. In terms of sex of the children ever born, the percentage of males is slightly higher (50.3%) than females (49.0%). The highest proportion of children surviving is within the age group 35-39 years (5,510) and the lowest proportion falls within the age group 12-14 years (8).
Children surviving include all children (male and female) born alive by females 12 years and older who are still living. Out of 45,799 born to the women aged 12 – 49 years, children surviving are 40,721. This means that the survival rate is 88.9 relative to the regional average survival rate of 862.0. The number of children ever born increases with age, reaching the highest point at age 39 years. In terms of sex of the surviving children, the percentage of males is slightly lower (49.9%) than that of females (50.1%).
Mortality
Mortality, as one of the three components of population change, plays an important role in determining the growth of a population. Mortality is the occurrence of death in a population. The level and pattern of mortality is a reflection of the health status of a population. Table 2.4 shows the total population, deaths in households and crude death rates for the district and the region. Crude Death Rate (CDR) is the number of deaths in a year per 1,000 mid-year population of a specific year.
The total number of deaths recorded in households in the Asutifi North District is 458, which translates into a crude death rate of 8.8 per 1000. The CDR for the district is relatively high compared to the regional CDR of 6.1 (see Table 2.4).
Age specific death rate
Figure 2.2 shows reported age specific death rates by sex. The rate is high at birth for the population below five years with female deaths slightly higher than the males. The male mortality rate recorded no death in the age 15-19 years while female mortality rate remains high through to age 39 years but it declined at age group 20-24 years. From age 60 years the male mortality rate declines but picks up momentum at 65 years and increases at a faster rate whereas that of the female increases faster to age 70 years and older picks up momentum at age 65 years; that is after five years.
Causes of deaths
Table 2.5 below presents the causes of death by district. Out of a total of 460 deaths recorded in the district, 31 persons constituting 6.7 percent are due to accident, violence, homicide and suicide while 429 persons (93.3%) are due to other causes such as natural deaths.
Migration
A migrant is a person whose current place of residence is different from his or her place of birth or previous place of residence. There are two types of migration, namely internal and external. Internal migration is the movement of people between geographical boundaries (administrative district) within national borders while external migration is the movement of people across geographical boundaries outside national borders.
Internal migration can be analysed in terms of intra and inter-regional movements. Intra-regional migration refers to the movement of people between localities within an administrative region (between administrative districts within the same region), while inter-regional migration is the movement of people between different administrative regions of the country. This is measured by information on place of birth as against place of enumeration of migrants.
Table 2.6 presents data on the place of birth of the population by duration of residence of migrants. In the entire district, the results of the 2010 PHC indicate that 20,236 persons representing 38.7 percent of the population are migrants.
Less than one-third (27.3%) of the migrants enumerated in the district were born elsewhere in the region (intra-regional migrants). A total of 14,273 migrants representing 70.5 percent were born in other regions in Ghana. Of those born in other regions, it emerged from the analysis that those who were born in the Ashanti Region form about one-third (33.6%); followed by the Upper East Region (18.3%) and Northern Region (10.4%). The remaining seven regions accounted for 37.7 percent of the inter-regional migrants in the district. A total of 445 persons enumerated in the district were born outside Ghana and constitute 2.2 percent of the migrants in the district.
With respect to duration of residence of migrants in the district, about one-third (36.5 %) of persons enumerated in the district have lived for one to four years with only 16.4 percent having lived in the district for 20 years and more. About one-half of the persons born outside Ghana have lived in the district for less than five years whereas 6.2 percent have lived for more than 20 years.
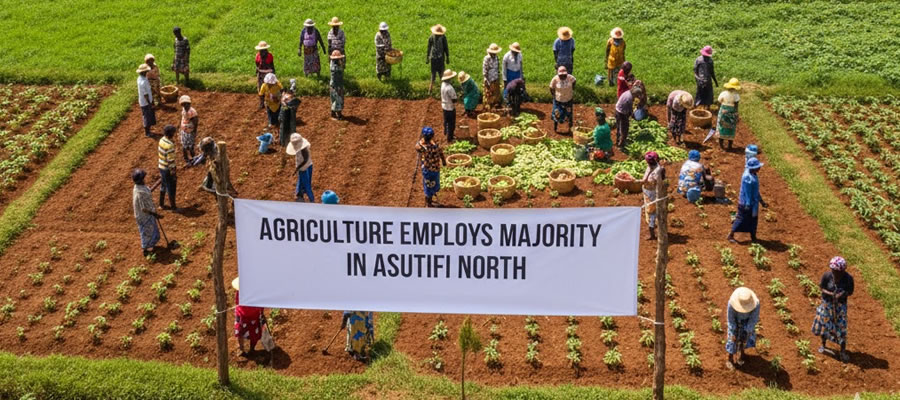
It is more likely that the presence of a mining company in the District and agricultural opportunities have accounted for the relative migrant population of 20,236 into the district compared to that of the region with a total of 751,196.
Date Created : 11/14/2017 5:01:30 AM