
Development Projections
This section of the plan represents the overall frame work within which development of the district will take place. This is usually called the development frame work/prospects. Projections have been made for all sectors of the district with particular reference to the three thematic areas of the GPRS II.
Demographic Projections
Since population is the basis of all planning activities various aspects of population have been projected for the district. These aspects include total population; population density, age and sex distribution, rural and urban population.
a. District Population
it has already been established by the 2000 Population and Housing census that the district has a population growth rate of 3.14% per annum. It is therefore assumed that the growth rate will remain fairly the same over the plan period. The table below shows the level in the district’s population with the medium term.
The table above indicates an increasing trend in both district population and population density. This is a clear indication of increase in pressure on existing facilities. Again, the situation implies a negative effect on the ecology, hence the need for the regulation in population growth and the formulation of policies to check land use to support the needed ecological balance.
b. Projected Trend in Population and Age Structure
Population projection for the broad age group of the district has been made for the planned period. The essence of this projection is not only to make adequate provision of all age groups, but also to determine the burden on dependants for the planned period and to formulate the needed policies to ameliorate the intended negative effects on dependants.
he underlying assumption of this projection is that, the percentage composition of the various age groups to the overall population will remain fairly unchanged over the planned period. The table below shows the cohort projection for the planned period
Based on the table above, the following table depicts the current and projected broad age group.
Rural Urban Estimates
The rural to urban population was also projected for the period. Urban and rural communities are defined in relation to threshold population. The table below gives the pattern of rural to urban population.
From the table above, it is clear that, rural population between 2000 and 2006 has been decreasing. This is as result of more rural communities reaching the threshold of urban status. Based on the above trend, it has been projected that rural population of the district will reach 60% and urban 40%
Local Economy
Projections were made so as to know the number of people who will be employed in the various sectors of the local economy by the end of the plan period. Projections under this sub-sector were made based on the following assumptions.
- Stable political and economic environment
- Agriculture will shed off labour to industry (small scale industries)
- Percentage employment level in the services and commerce sector will not change significantly throughout the plan period.
- Employment level will increase to 85%
Human Resource Development and Basic Services
Projections under this thematic area have been focused on education and health with emphasis on public facilities for health and education.
Health
Projections under health care delivery have been based on the Primary Health Care Concept. The following table depicts thresholds for the various levels
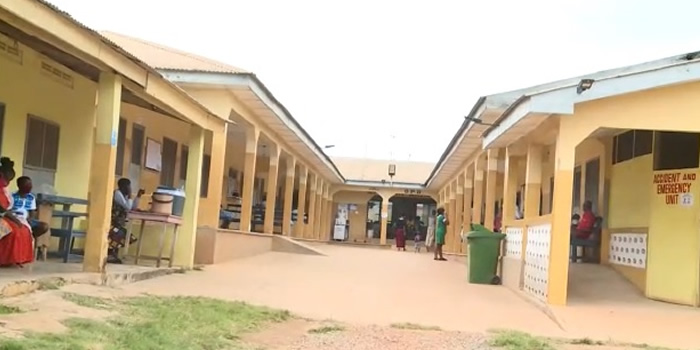
Even though the above table depicts short falls in the various levels of health delivery as per threshold assessment, physical accessibility to health delivery in the district is within range as shown by the accessibility map. Efforts will therefore be directed at upgrading the Agona Health Centre to a hospital status and facilities in the existing levels improved to support modern health delivery.
Education
Projections under education were considered in the area of
- number of schools (demand for schools)
- school participation rates
- demand for trained teachers
- enrollment levels
Demand for Schools
By using a standard threshold of 2500 population to a primary/JSS and 35,000 for SSS, the table below shows the situation for the planned periods.
EN – EXISTING NUMBER
RN – REQUIRED NUMBER
SN – STRESS
Even though the above projections depict the availability of educational infrastructure sufficient for both JSS and SSS, the realities in the communities depicts otherwise. The district will therefore drive toward the provision of more infrastructure as enrolment is likely to rise and also rehabilitate exiting structures to improve upon the learning environment of the district.
Estimated Population for School Going Age
It is assumed that between the ages 0-14, primary / JSS and 15-19, S.S.S. with the estimation of these age groups for the planned period, the school participation levels can be computed and thus necessary provisions made for pupils and students for the planned period. The tables below show the estimated populations of school going ages, school participation rates for the planned period and enrollkment rates at the various levels of education.
From table 1.3.3e above, it is obvious that school participation rates at the pre-school level, is not encouraging. With a decrease from 29% in 2000 to 28.5% in 2002, a target of 30% has been set and efforts will be made to reach that.
The above framework shows that facilities in the district are either adequate or not under much stress hence the district will direct its attention to the maintenance, improvement, provision of structures and rehabilitation of existing structures of facilities in the medium term.
Development Objectives
Based on the goals set for the various thematic areas for the district, the following objectives have been set for the overall achievement of the set goals.
Private Sector-Led Competitiveness
Objectives
- To improve the surface accessibility of 50% of roads in the district by 2009
- To improve upon market facilities in five communities in the district by 2009
- To train 500 farmers in improved farming methods and practices by 2009
- To increase storage potential to 70% by 2009
- To train 250 practicing and potential entrepreneurs in small business management skills by 2009
- To provide micro credit for 900 farmers under the youth employment programme by 2009
- To generate 1,835 jobs under the youth employment programme by 2009
- To support 230 practicing and potential entrepreneurs through the by 2009
- To support 200 entrepreneurs to source grant from the African Development Fund (ADF) by 2009
- To support 20 practicing entrepreneurs to attend local and international trade fairs by 2009
Human Resource Development
Objectives:
Education
- To improve upon the physical state of 5 educational institutions by 2009
- To reduce the number of untrained teachers in the district by 20% by 2009
- To improve upon the physical state of 10 basic schools by 2009
- To provide logistics for 10 circuit school supervisors by 2009
- To increase teachers accommodation in five Area Councils in the district by 2009
- To increase classroom blocks by 10% by 2009
Health
- To achieve 50% success rate of the malaria roll back programme by 2009
- To reduce HIV/AIDS incidence rate to 2.9% by 2009
- To provide a district hospital by 2009
- To equip three health centres in the district with modern facilities by 2009
- To reduce the incidence rate of cholera and typhoid by 70% by 2009
- To increase the number of paramedical staff by 5% by 2009
Population Management
- To reduce the population growth rate from 3.14% to 3.0% by the year 2009
- To embark on bi-annual educational campaign on family planning methods by 2009
Safe Water and Environmental Sanitation
- To increase access to household VIP and institutional KVIP latrines to 90% by 2009
- To increase access to potable water supply to 95% by 2009
- To reduce environmental degradation by 40% 2009
- To increase waste disposal sites by 50% by 2009
- To provide two final waste disposal sites in the district by 2009
Urban Development
- To improve upon convenience and aesthetics in the built up environment by 2009
Mainstreaming the Vulnerable and Excluded
- To integrate and average of five (5) physically challenged into the informal apprenticeship training every year.
- To increase awareness level of teenage pregnancy and other social vices by 30% by 2009
Good Governance and Civic Responsibility
Objectives:
- To staff 50% of Area Council offices in the district by 2009
- To provide furniture/logistics in all Area Councils by 2009
- To improve on revenue generation by 3% by 2009
- To rehabilitate three staff bungalows by 2009
- To increase staff accommodation by 3. by 2009
- To rehabilitate 10 staff quarters by 2009
- To furnished the DPCU by 2009
- To establish a data bank for the DPCU by 2009
- To improve upon offices of deprived decentralized departments by 2009
Linking The District Objectives To The MDGs
Since the world is gradually becoming a global village, there is the need to determine whether district objectives formulated are in line with the MDGs. The table below indicates the link between the district objectives and the MDGs.
Date Created : 11/24/2017 5:30:58 AM


 facebook
 twitter
 Youtube
 +233 593 831 280
 0800 430 430
 GPS: GE-231-4383
 info@ghanadistricts.com
 Box GP1044, Accra, Ghana